Open Access
Fig. A.3
Download original image
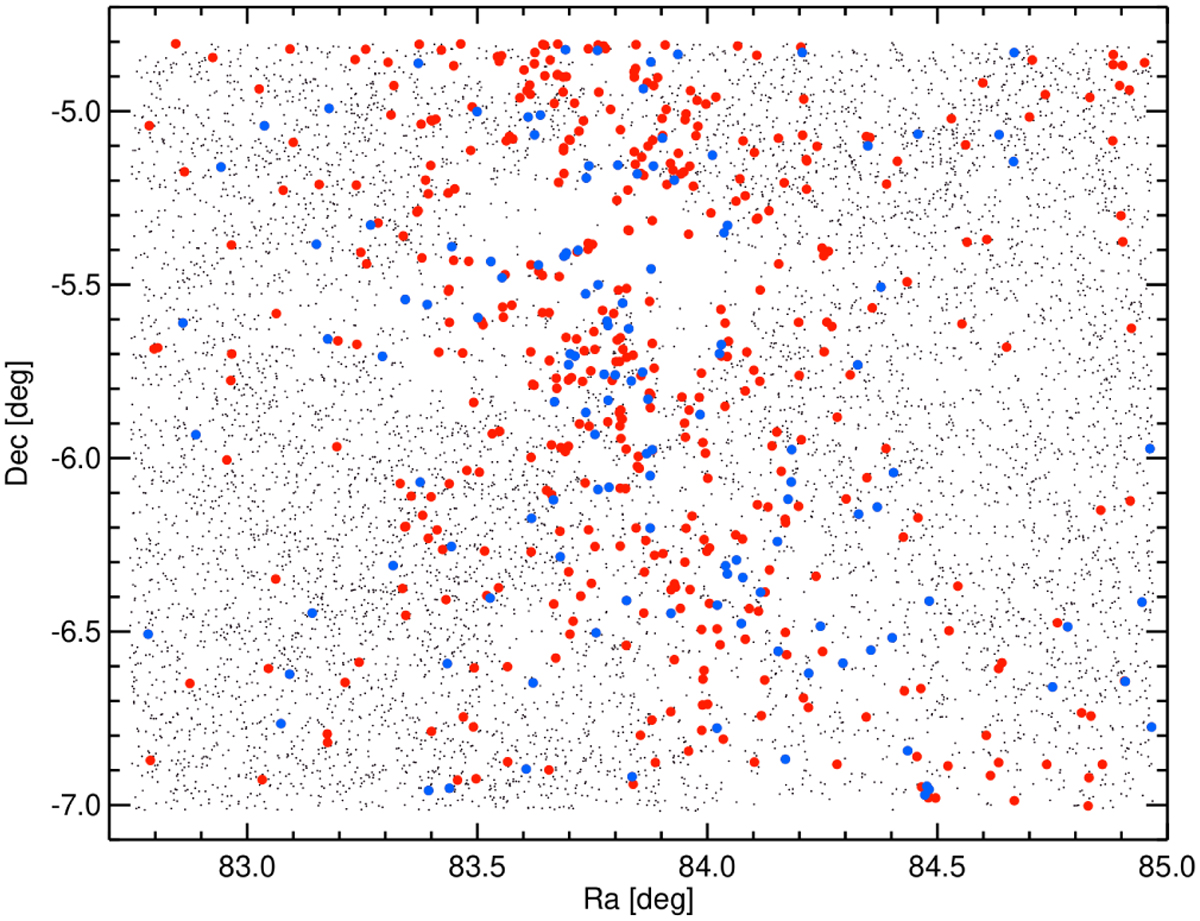
Spatial distribution of YSOs in the field of view. The red dots represent 561 variable objects with 5σ detections, the blue dots show 147 periodic objects.
Current usage metrics show cumulative count of Article Views (full-text article views including HTML views, PDF and ePub downloads, according to the available data) and Abstracts Views on Vision4Press platform.
Data correspond to usage on the plateform after 2015. The current usage metrics is available 48-96 hours after online publication and is updated daily on week days.
Initial download of the metrics may take a while.