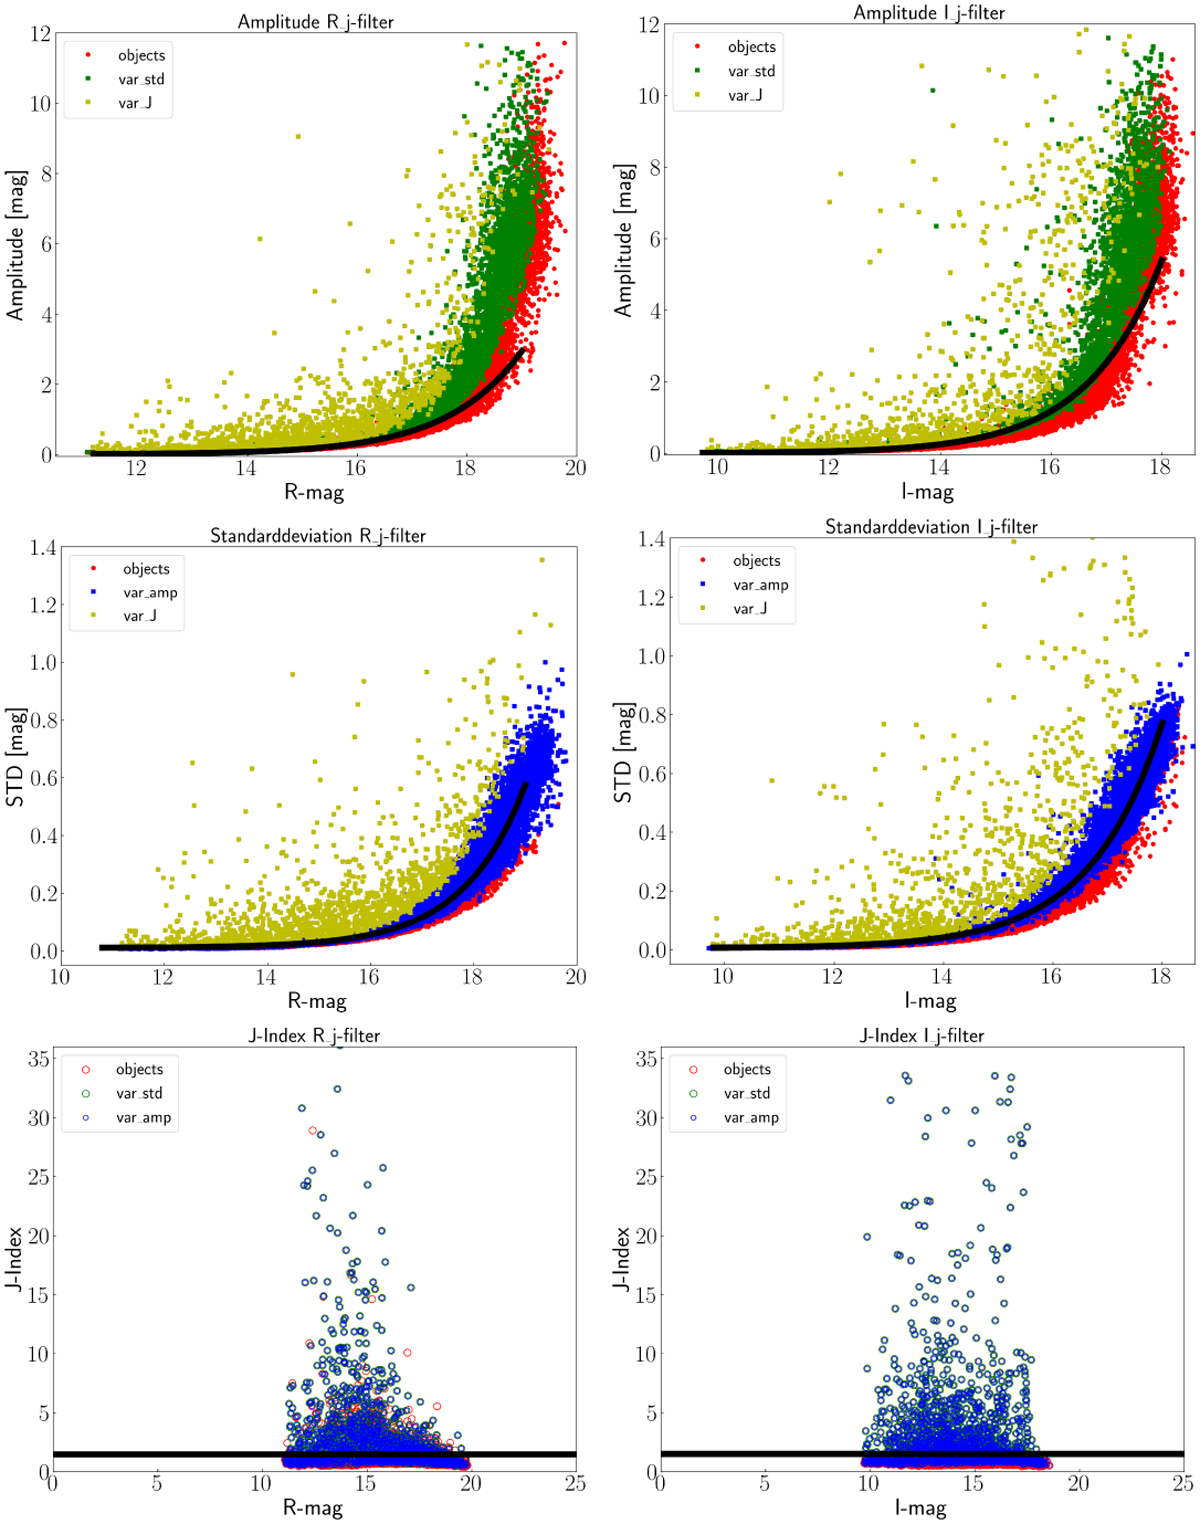
Fig. A.2
Download original image
Identification of variable objects with three different methods for the filters R and I. The diagrams on top and in the middle show the amplitude and S D methods respectively. For both methods, the threshold varies exponentially because the scatter and noise are higher for weak objects. The lower diagrams show the J–index method. We established an empirical threshold of 1.35 after conducting a detailed examination of the light curves for variable candidates that were also detected using other methods. This threshold was further refined by eliminating spurious detections.
Current usage metrics show cumulative count of Article Views (full-text article views including HTML views, PDF and ePub downloads, according to the available data) and Abstracts Views on Vision4Press platform.
Data correspond to usage on the plateform after 2015. The current usage metrics is available 48-96 hours after online publication and is updated daily on week days.
Initial download of the metrics may take a while.