Fig. 17
Download original image
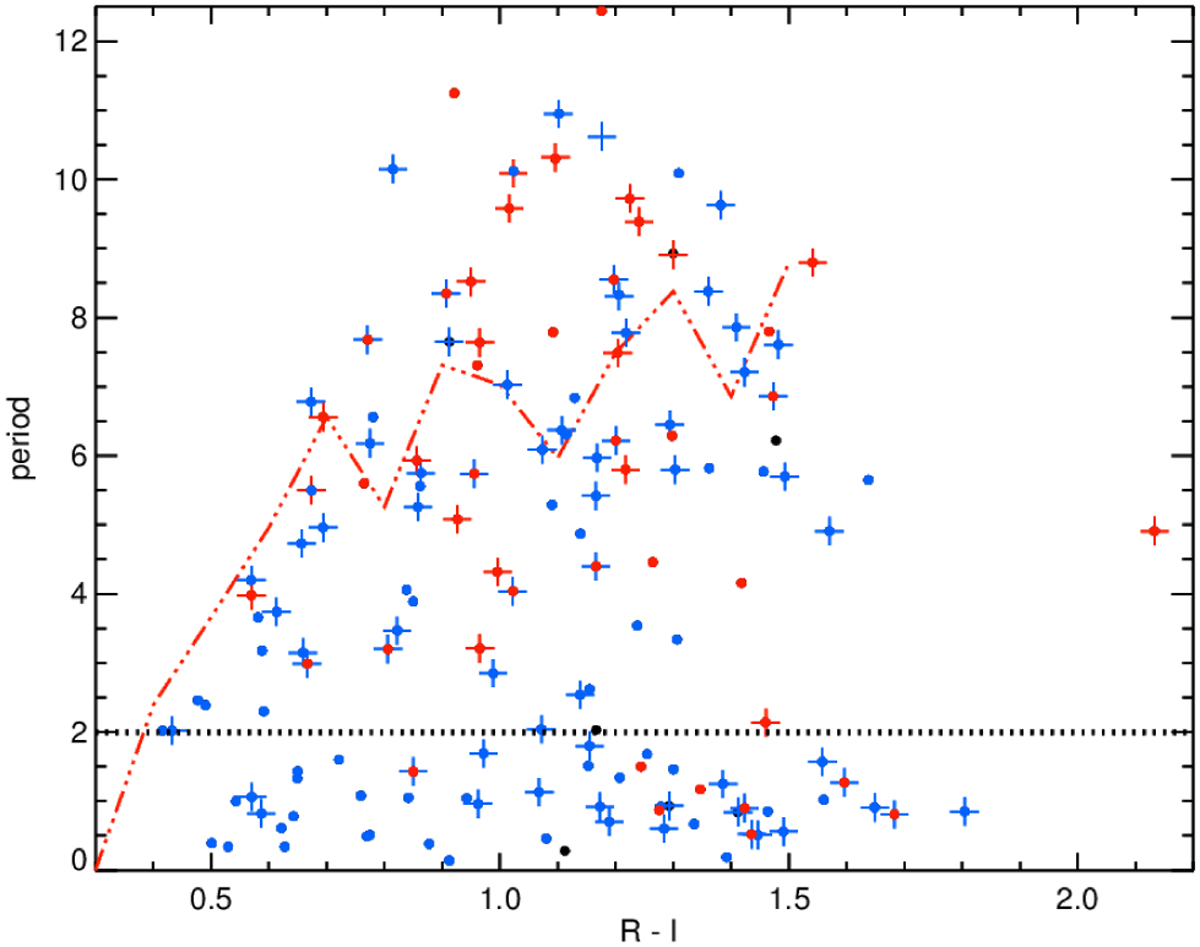
Distribution of periods vs. R − I color. Class flat sources are indicated in black, Class II sources in red, and Class III sources in blue. The CTTS and WTTS are marked with red and blue crosses, respectively. The red dashed-dotted line represents the median of the period within a 0.1 bin size in the color R − I, taking into account periods over 2 days (horizontal black dotted line).
Current usage metrics show cumulative count of Article Views (full-text article views including HTML views, PDF and ePub downloads, according to the available data) and Abstracts Views on Vision4Press platform.
Data correspond to usage on the plateform after 2015. The current usage metrics is available 48-96 hours after online publication and is updated daily on week days.
Initial download of the metrics may take a while.