Fig. 10
Download original image
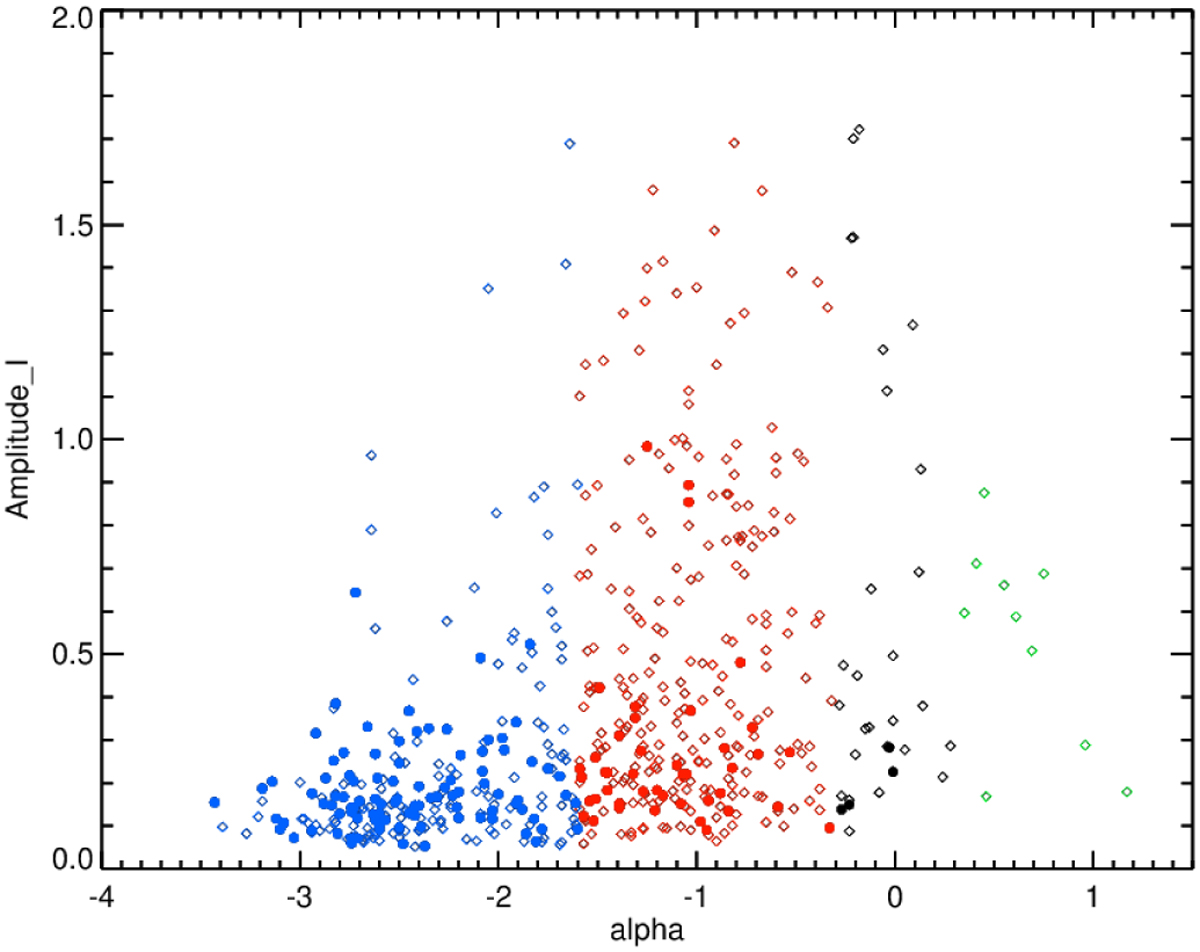
Variability amplitude as a function of the spectral index, α. Blue points represent Class III objects, red points indicate Class II objects, green points are Class I objects, and black points Class Flat objects. Class II objects generally show higher variability amplitudes compared to other classes, especially notable in nonperiodic objects (see the text).
Current usage metrics show cumulative count of Article Views (full-text article views including HTML views, PDF and ePub downloads, according to the available data) and Abstracts Views on Vision4Press platform.
Data correspond to usage on the plateform after 2015. The current usage metrics is available 48-96 hours after online publication and is updated daily on week days.
Initial download of the metrics may take a while.