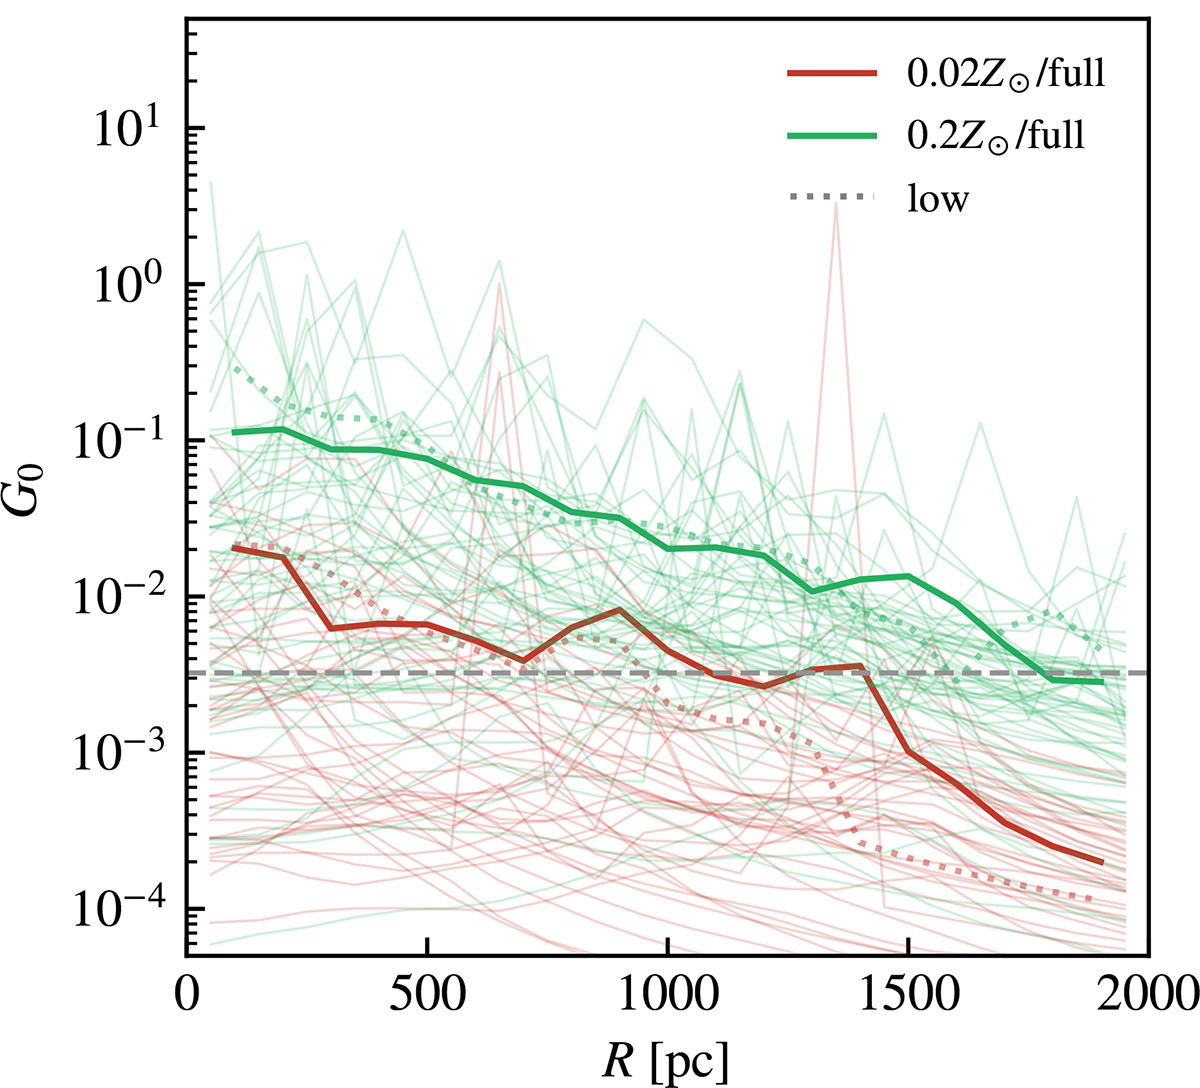
Fig. 9.
Download original image
5.8−13.6 eV ISRF normalized to the Habing (1968) unit as a function of R in the ISM regions for the 0.02 Z⊙/full and 0.2 Z⊙/full galaxies. The solid curves are the stacked results from 300 Myr to 1000 Myr, while the translucent curves are the results of individual snapshots with a spacing of 20 Myr. The dotted curves present the stacked results of the corresponding low-resolution galaxies. The grey dashed line shows the value of the background FUV field of G0, UVB = 0.00 324.
Current usage metrics show cumulative count of Article Views (full-text article views including HTML views, PDF and ePub downloads, according to the available data) and Abstracts Views on Vision4Press platform.
Data correspond to usage on the plateform after 2015. The current usage metrics is available 48-96 hours after online publication and is updated daily on week days.
Initial download of the metrics may take a while.