Fig. 8.
Download original image
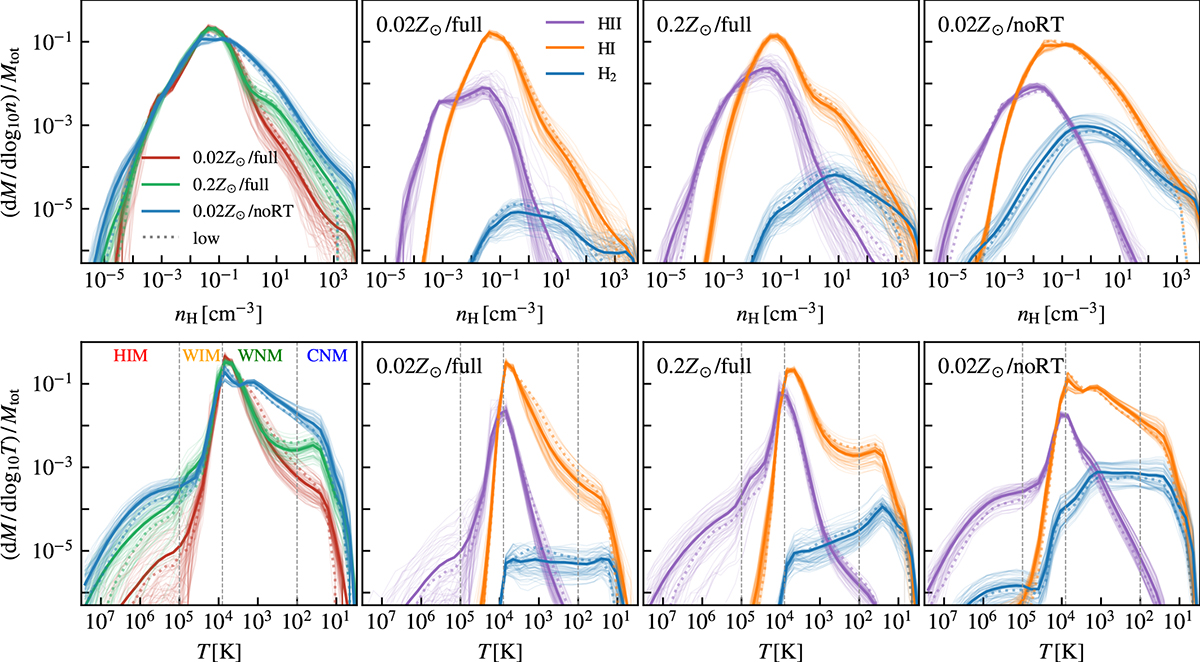
Probability Distribution Functions (PDFs) of gas density (top row) and temperature (bottom row) in the ISM region, weighted by mass for a stack of the simulated galaxies from 300 Myr to 1000 Myr (solid curves) in the ISM regions. The translucent curves are the PDFs of individual snapshots with a spacing of 10 Myr. The x-axes of the T-PDFs are inverted to plot the hot, diffuse gas on the left and the cold, dense gas on the right as the n-PDF. The dotted curves show the stacked results for the low-resolution simulation. The first column shows the PDFs of all the gas in the disk, while the second to fourth columns show the mass distribution of gas for different galaxies weighted by H II (purple), H I (orange), and H2 (blue) fractions. The dashed vertical lines on the T-PDFs indicate the boundaries of the CNM, WNM, WIM, and HIM phases, whose corresponding mass and volume fractions in the ISM have been presented in Fig. 6. The ISM in three galaxies with different metallicities and feedback channels are all dominated by the warm (∼104 K) diffuse (∼1 cm−3) H I gas. Radiative feedback leads to significantly less buildup of H2 in metal-poor environments.
Current usage metrics show cumulative count of Article Views (full-text article views including HTML views, PDF and ePub downloads, according to the available data) and Abstracts Views on Vision4Press platform.
Data correspond to usage on the plateform after 2015. The current usage metrics is available 48-96 hours after online publication and is updated daily on week days.
Initial download of the metrics may take a while.