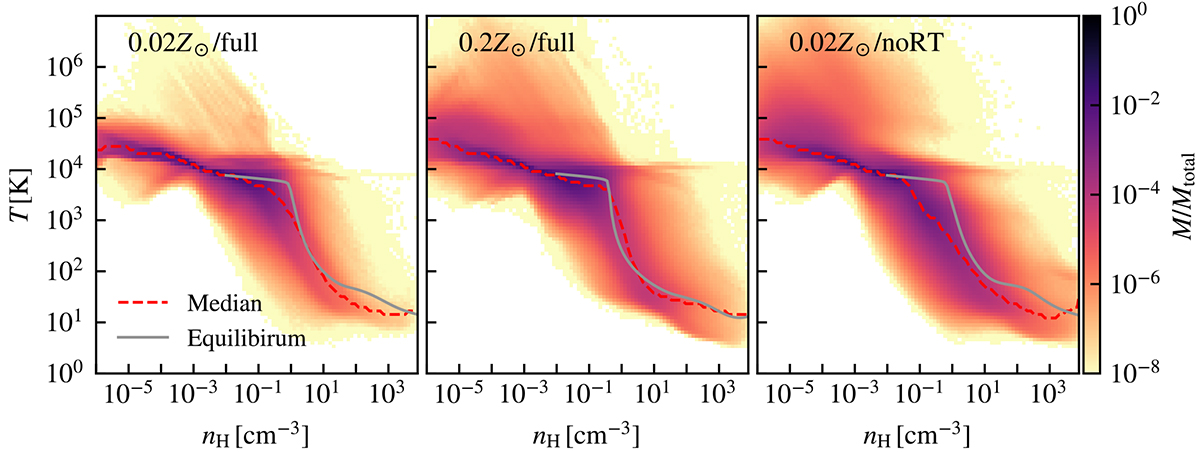
Fig. 7.
Download original image
Mass-weighted gas phase diagrams for the high-resolution galaxies averaged over the snapshots from t = 300 Myr to t = 1000 Myr with a time interval of 10 Myr. The red dashed curves represent the median temperature within each density bin. The grey curves are the equilibrium temperature assuming G0 = 0.01, 0.1, and 0.00324 for 0.02 Z⊙/full, 0.2 Z⊙/full, and 0.02 Z⊙/noRT, respectively.
Current usage metrics show cumulative count of Article Views (full-text article views including HTML views, PDF and ePub downloads, according to the available data) and Abstracts Views on Vision4Press platform.
Data correspond to usage on the plateform after 2015. The current usage metrics is available 48-96 hours after online publication and is updated daily on week days.
Initial download of the metrics may take a while.