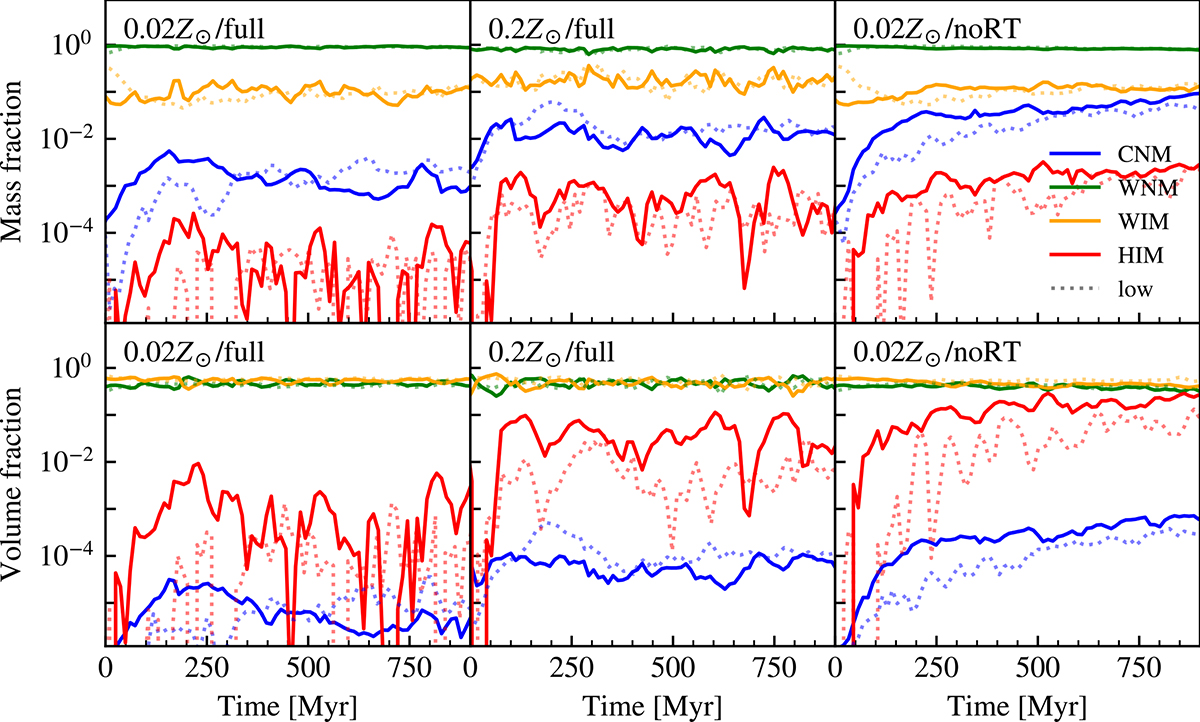
Fig. 6.
Download original image
Time evolution of the mass fractions (top row panels) and volume fractions (bottom row panels) of gas in the ISM regions (R < 2 kpc and |z|< 1 kpc) in the cold neutral medium (CNM, T < 100 K, blue curves), the warm neutral medium (WNM, 100 < T < 8000 K, green curves), the warm ionized medium (WIM, 8000 < T < 100 000 K, orange curves), and hot ionized medium (HIM, T > 100 000 K, red curves) phases. The dotted curves are from the low-resolution runs. Figure 8 shows how these phases are distributed across the mass-weighted ISM probability distribution functions. Both higher metallicity and noRT runs exhibit significantly more CNM and HIM fractions due to the more efficient gas cooling and collapse (induced by higher cooling rate and lower heating rate in 0.2 Z⊙/full and 0.02 Z⊙/noRT, respectively), and the resultant higher SFRs.
Current usage metrics show cumulative count of Article Views (full-text article views including HTML views, PDF and ePub downloads, according to the available data) and Abstracts Views on Vision4Press platform.
Data correspond to usage on the plateform after 2015. The current usage metrics is available 48-96 hours after online publication and is updated daily on week days.
Initial download of the metrics may take a while.