Fig. 4.
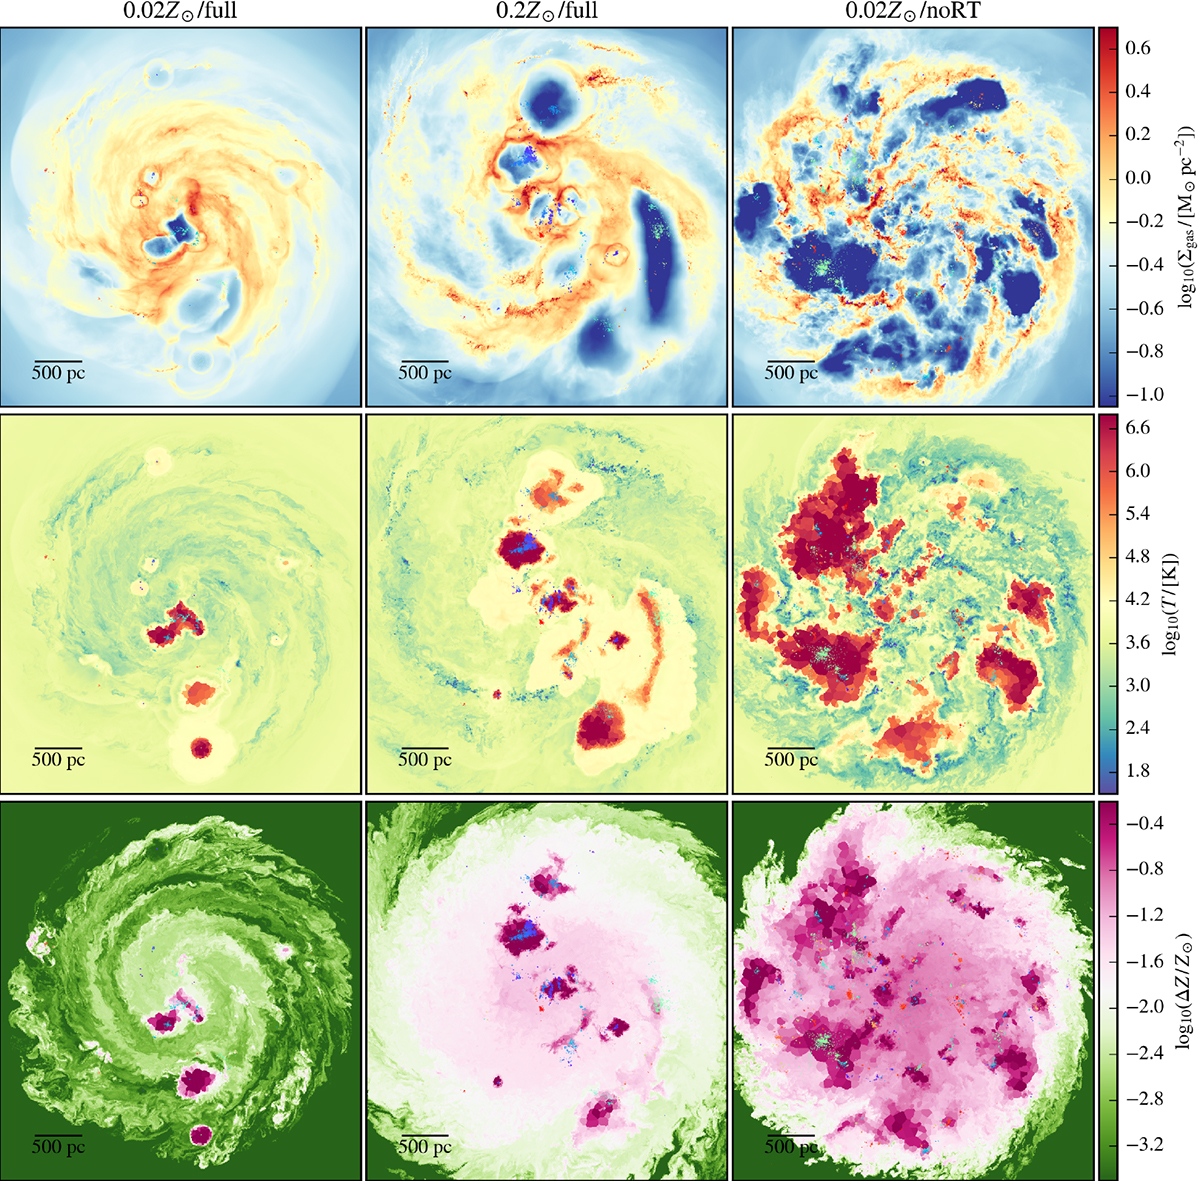
Download original image
Face-on images of the integrated gas mass surface density (Σgas; top row), along with mid-plane slices of gas temperature (T; middle row), and metallicity increment (ΔZ = Z − Zinit; bottom row) of the simulated galaxies at 900 Myr. The three columns correspond to the different runs, as labeled above the panels. From left to right, they are 0.02 Z⊙/full, 0.2 Z⊙/full, and 0.02 Z⊙/noRT, respectively. The overset points represent young stars (< 100 Myr) with ages color-coded from violet (youngest) to red (oldest).
Current usage metrics show cumulative count of Article Views (full-text article views including HTML views, PDF and ePub downloads, according to the available data) and Abstracts Views on Vision4Press platform.
Data correspond to usage on the plateform after 2015. The current usage metrics is available 48-96 hours after online publication and is updated daily on week days.
Initial download of the metrics may take a while.