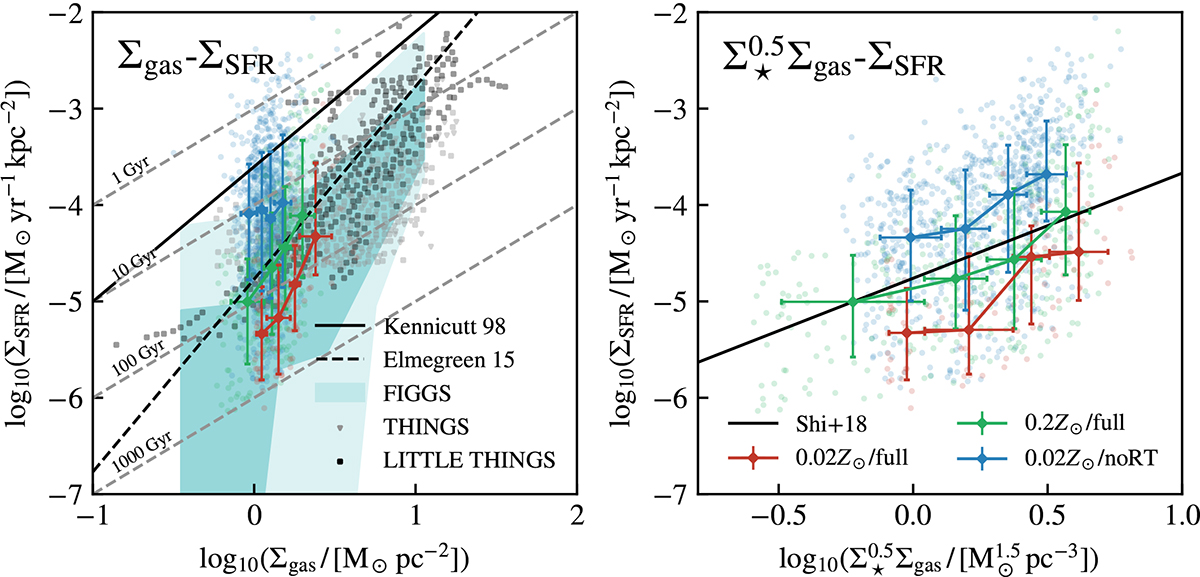
Fig. 3.
Download original image
Star formation relations in the simulated dwarf galaxies. Left: Kennicutt-Schmidt relation for the simulated high-resolution galaxies for the 0.02 Z⊙/full (red), 0.2 Z⊙/full (green), and 0.02 Z⊙/noRT (blue) model. The translucent data points are 1 Myr average SFR within a series of 100 pc annuli measured from the simulation time t = 300 Myr to 1000 Myr. The data with errorbars are the median ΣSFR of the [0, 25), [25, 50), [50, 75), [75, 100] gas surface density percentile bins, and the errorbars of ΣSFR show the 16 and 84 percentiles of the SFR surface density in each bin. The black solid line shows the standard KS relation from Kennicutt (1998); the black dashed line shows the power-2 relation for outer disk regions and dwarf irregular galaxies from Elmegreen (2015). The observational data collected by Elmegreen (2015), including the far outer regions of spirals and dwarf galaxies from the THINGS survey (Bigiel et al. 2010) and the dwarf galaxies from the LITTLE THINGS survey (Elmegreen & Hunter 2015), are shown as grey and black dots, respectively. The blue-shaded region is the 5−95 and 16−84 percentile range of the observed dwarf galaxies in the FIGGS survey (Roychowdhury et al. 2015). Right: extended KS relation (ΣSFR ∝ (Σ⋆0.5Σgas)1.09, Shi et al. 2011, 2018) measured in the same way; the black solid line is the fitting of observed data of star-forming galaxies of various types from Shi et al. (2018).
Current usage metrics show cumulative count of Article Views (full-text article views including HTML views, PDF and ePub downloads, according to the available data) and Abstracts Views on Vision4Press platform.
Data correspond to usage on the plateform after 2015. The current usage metrics is available 48-96 hours after online publication and is updated daily on week days.
Initial download of the metrics may take a while.