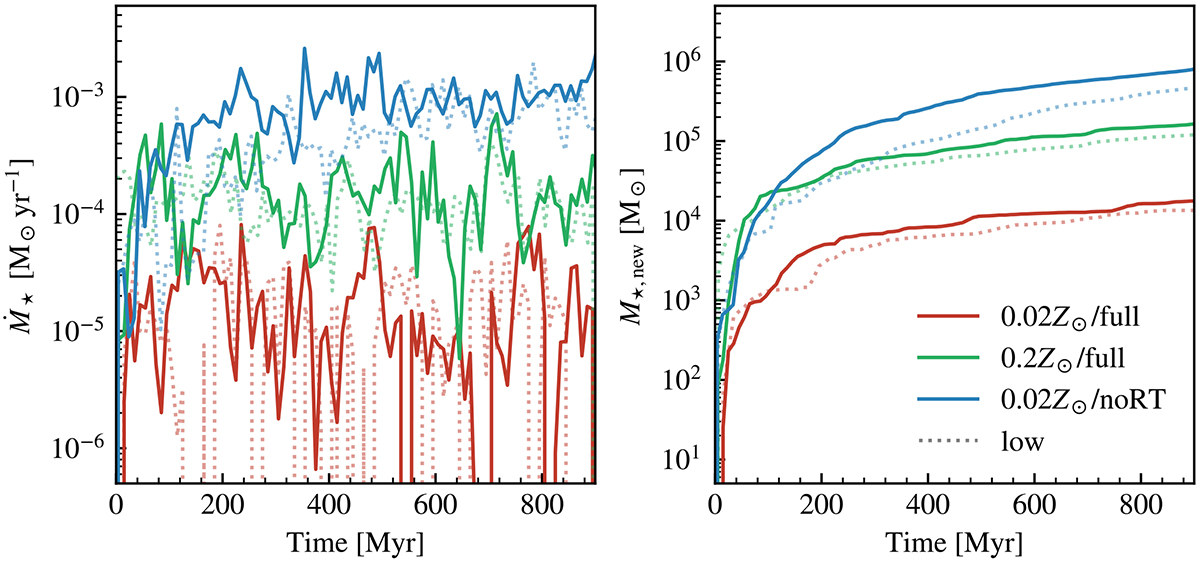
Fig. 2.
Download original image
Star formation histories of the simulated dwarf galaxies. Left: SFR as a function of time. The SFR is averaged over a time-scale of 10 Myr. The solid curves are the results from the high-resolution runs while the dotted curves are from corresponding low-resolution runs. Right: Cumulative mass of newly formed stars in our simulations. The SFRs exhibit good convergence with resolution. The 0.02 Z⊙/noRT simulations show the most significant difference in cumulative stellar mass between the low- and high-resolution simulations; nonetheless, the difference remains within a factor of two.
Current usage metrics show cumulative count of Article Views (full-text article views including HTML views, PDF and ePub downloads, according to the available data) and Abstracts Views on Vision4Press platform.
Data correspond to usage on the plateform after 2015. The current usage metrics is available 48-96 hours after online publication and is updated daily on week days.
Initial download of the metrics may take a while.