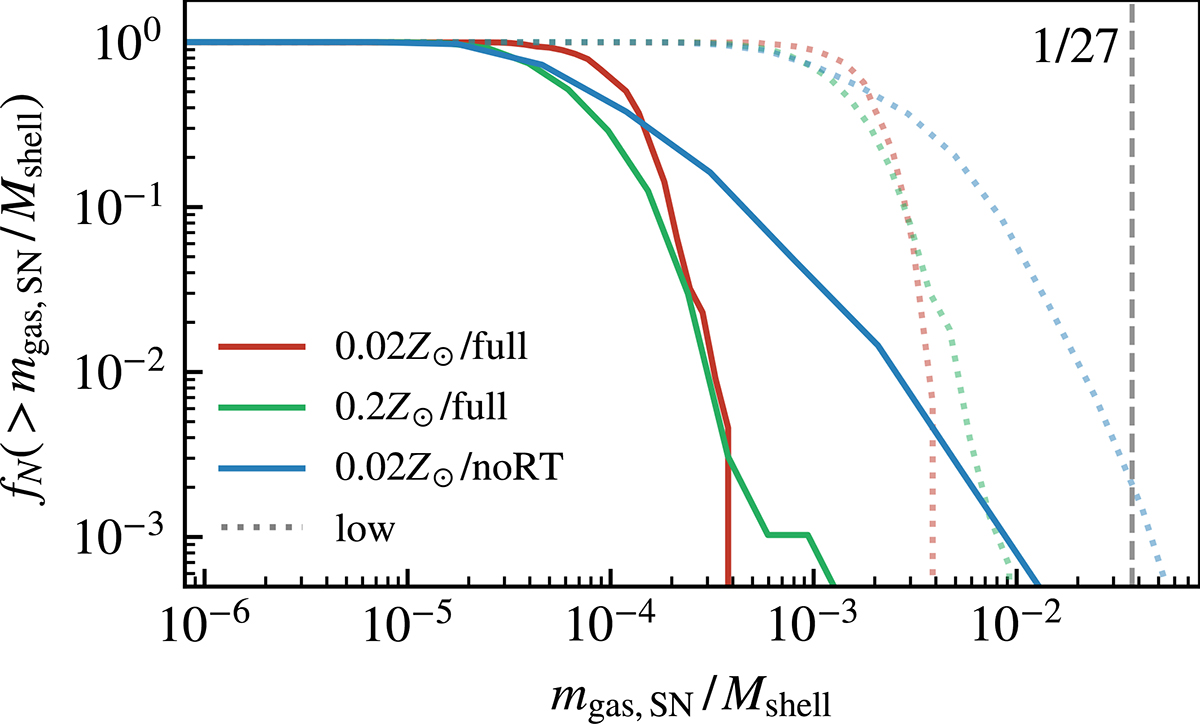
Fig. C.1.
Download original image
Cumulative distribution function of the ratio between the mass of the cell where the SNe injected explosion energy and the total swept-up mass at end of the energy conserving Sedov-Taylor phase (shell formation) given by equation (12). The red and green curves are the 1 M⊙ resolution results obtained with the fiducial RIGEL model, while the blue curve is obtained without radiative feedback (see Section 3 for the naming conventions). The dotted curves are the results of the 10 M⊙ resolution simulations. The vertical dashed line denotes the ST-resolving criterion of mgas, SN / Mshell < 1/27 by Kim & Ostriker (2015).
Current usage metrics show cumulative count of Article Views (full-text article views including HTML views, PDF and ePub downloads, according to the available data) and Abstracts Views on Vision4Press platform.
Data correspond to usage on the plateform after 2015. The current usage metrics is available 48-96 hours after online publication and is updated daily on week days.
Initial download of the metrics may take a while.