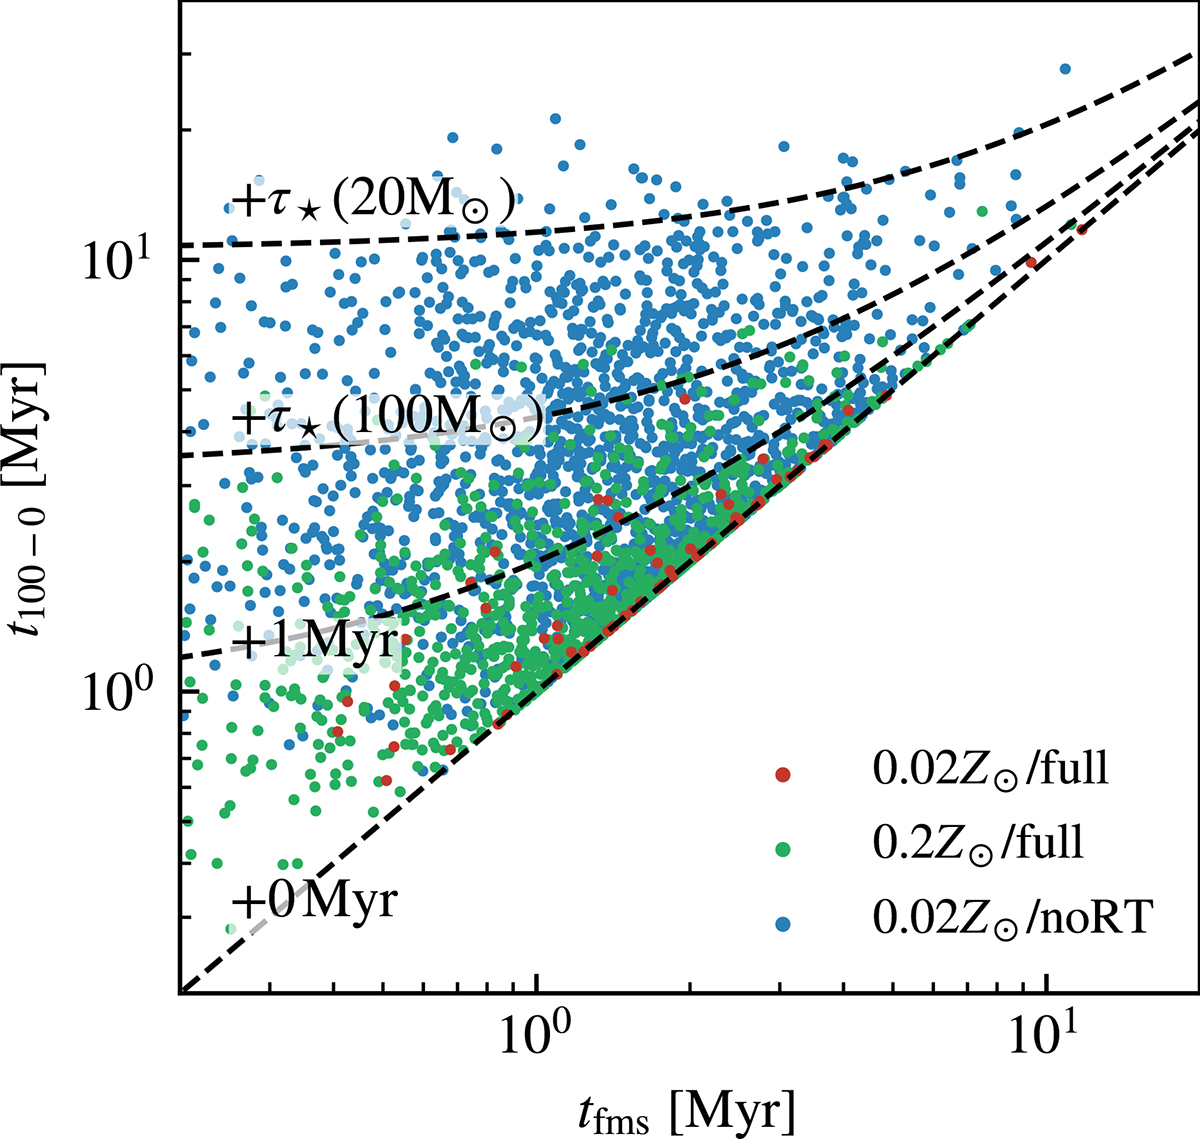
Fig. 14.
Download original image
Time between the formation of the first and last member star of a cluster (t100 − 0) as the function of the time of the first massive star in the cluster (tfms). The black dashed curves present the line of t100 − 0 = tfms + {0 Myr, 1 Myr, τ⋆(100 M⊙),τ⋆(20 M⊙)}, where τ⋆(100 M⊙) and τ⋆(20 M⊙) are the lifetimes for 100 M⊙ and 20 M⊙ massive stars. The time between t100 and tfms are smaller than 1 Myr for most clusters in the full feedback simulations, much shorter than the time required for the first SN explosion.
Current usage metrics show cumulative count of Article Views (full-text article views including HTML views, PDF and ePub downloads, according to the available data) and Abstracts Views on Vision4Press platform.
Data correspond to usage on the plateform after 2015. The current usage metrics is available 48-96 hours after online publication and is updated daily on week days.
Initial download of the metrics may take a while.