Fig. 13.
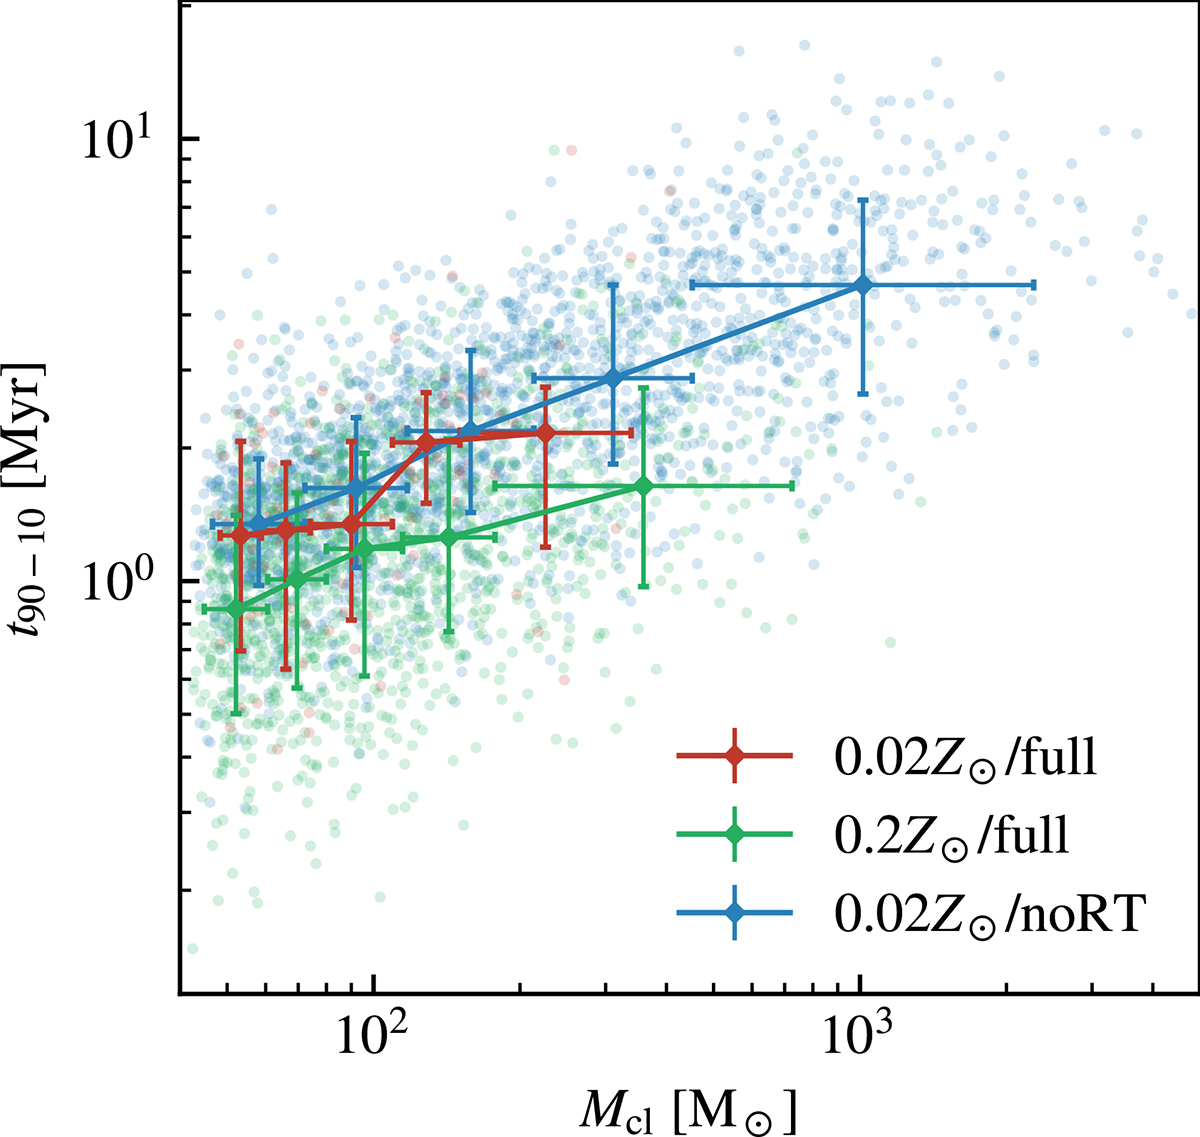
Download original image
Age spreads of the clusters (t90 − 10) as the function of the cluster initial mass. The data with errorbars present the median age spreads of the [0, 20), [20, 40), [40, 60), [60, 80), [80, 100] cluster initial mass percentile bins, and the vertical errorbars show the 16 and 84 percentiles of the age spreads in each bin. More massive clusters exhibit larger age spreads, suggesting that the final mass of the cluster is influenced by the duration of star formation within the cloud when there is no disruptive stellar feedback.
Current usage metrics show cumulative count of Article Views (full-text article views including HTML views, PDF and ePub downloads, according to the available data) and Abstracts Views on Vision4Press platform.
Data correspond to usage on the plateform after 2015. The current usage metrics is available 48-96 hours after online publication and is updated daily on week days.
Initial download of the metrics may take a while.