Fig. 12.
Download original image
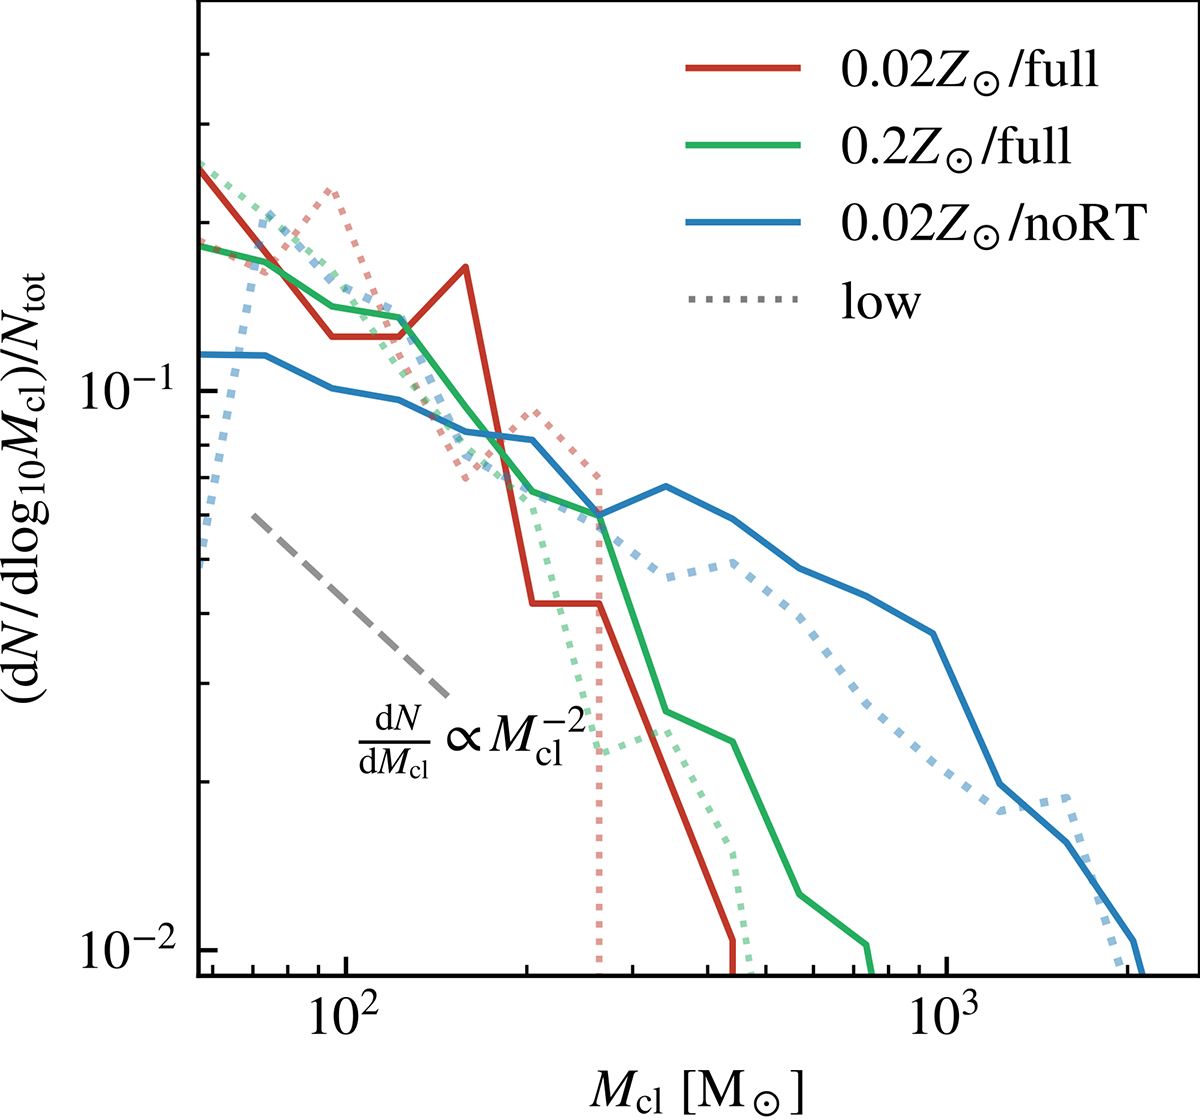
Cluster initial mass functions of the simulated galaxies. The solid curves are the results of the high-resolution simulations, while the dotted curves are the results of the corresponding low-resolution galaxies. The grey dashed line presents the observed power-law relation with a slope of −2. Radiative feedback steepens the mass functions by rapidly dispersing the clouds and shutting off the further star formation.
Current usage metrics show cumulative count of Article Views (full-text article views including HTML views, PDF and ePub downloads, according to the available data) and Abstracts Views on Vision4Press platform.
Data correspond to usage on the plateform after 2015. The current usage metrics is available 48-96 hours after online publication and is updated daily on week days.
Initial download of the metrics may take a while.