Fig. 1.
Download original image
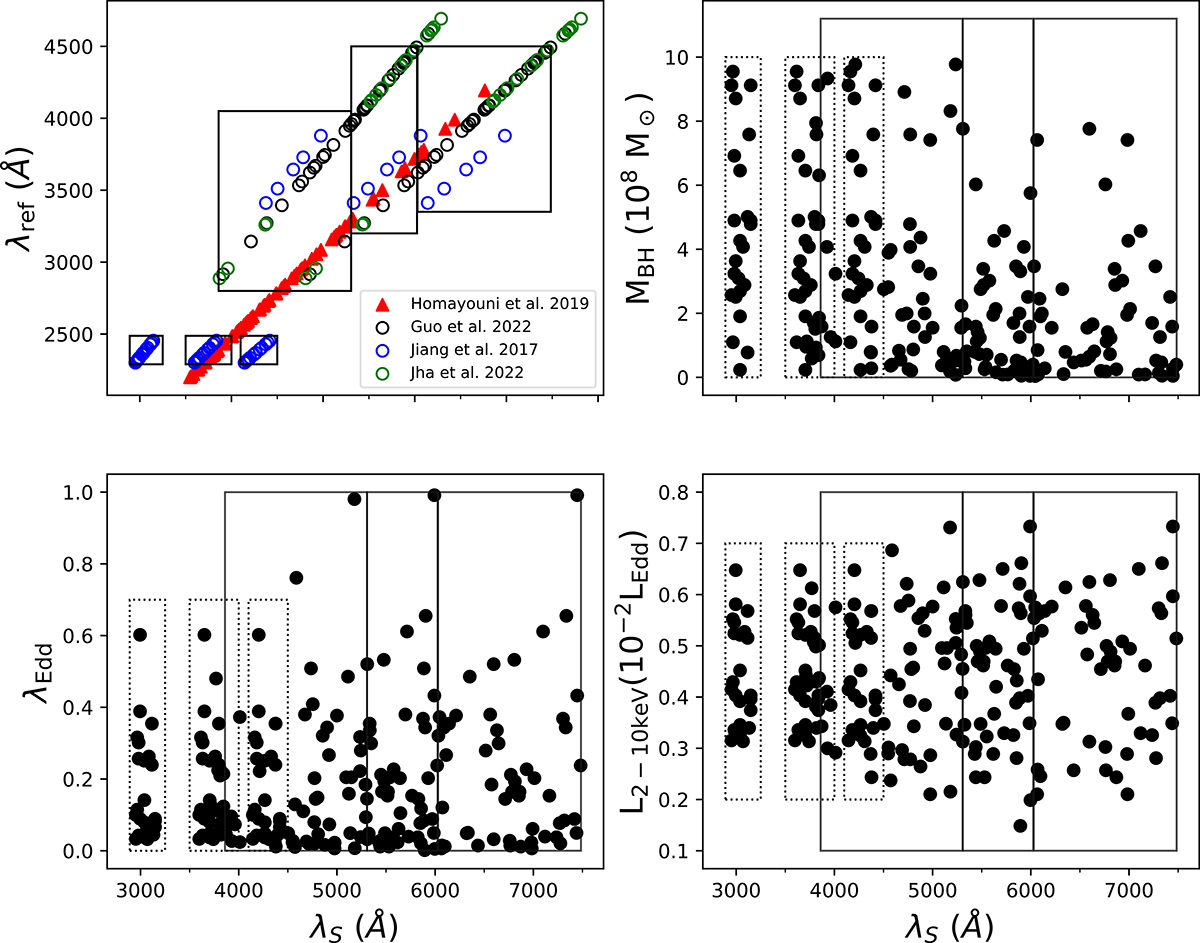
Upper left panel: The rest frame wavelength of the reference band (in our work always the g-band), λref, versus the rest frame wavelength of the secondary light curves, λS, used to measure the time lags. Upper right panel: The MBH as a function of λS for the objects in our final sample. Bottom panels: Same as the top right panel but for λEdd and L2 − 10 keV (left and right panels, respectively). The boxes in all panels indicate the measurements we used to compute the mean time-lags spectrum.
Current usage metrics show cumulative count of Article Views (full-text article views including HTML views, PDF and ePub downloads, according to the available data) and Abstracts Views on Vision4Press platform.
Data correspond to usage on the plateform after 2015. The current usage metrics is available 48-96 hours after online publication and is updated daily on week days.
Initial download of the metrics may take a while.