Fig. 6
Download original image
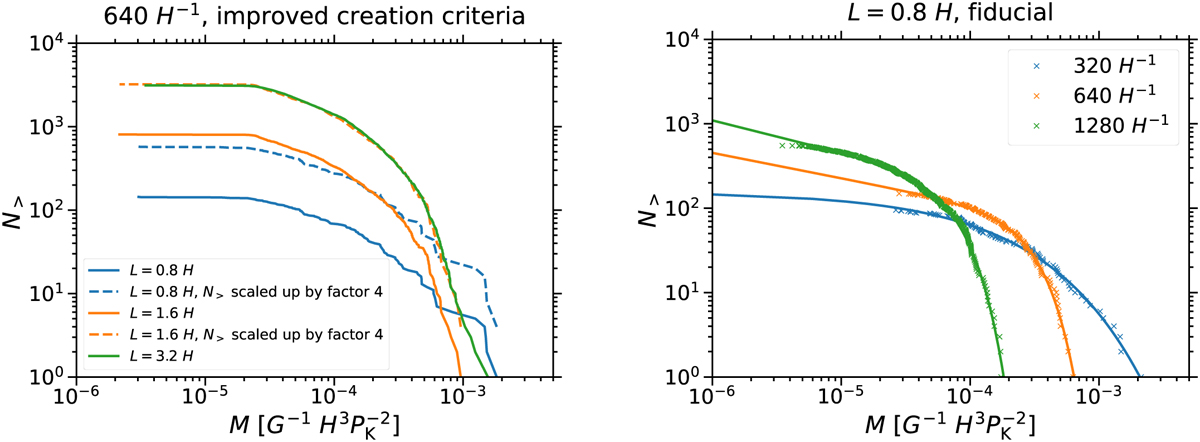
Dependence of sink particle mass distribution on domain extent and resolution. Left panel: domain size dependence. Solid lines represent the cumulative mass distributions at the end of simulations with radial and azimuthal domain sizes of L = Lx = Ly = 0.8 H (blue line), L = 1.6 H (orange line), or L = 3.2 H (green line). Dashed lines, on the other hand, depict the respective cumulative numbers multiplied by a factor of 4, which corresponds to the difference in volume between the domains. The resolution is fixed at 640 H−1 and the improved criteria for sink particle creation were applied in all three simulations. While the cumulative numbers in the L = 3.2 H-simulation are almost exactly four times higher than in the L = 1.6 H-simulation, for low/high masses they are more/less than four times greater in the L = 1.6 H-simulation than in the L = 0.8 H- simulation. Right panel: resolution dependence. Cumulative mass distributions at the end of simulations with a domain extent of L = 0.8 H, the fiducial sink particle creation criteria, and resolutions of 320 H−1 (blue crosses), 640 H−1 (orange crosses), or 1280 H−1 (green crosses). The distributions are each fitted with an exponentially tapered power law (solid lines). Both the power-law part and the exponential tapering are comparably steep for the two higher resolutions, but significantly shallower for the lowest resolution. In the latter case, the distribution is in fact represented best by only an exponential function.
Current usage metrics show cumulative count of Article Views (full-text article views including HTML views, PDF and ePub downloads, according to the available data) and Abstracts Views on Vision4Press platform.
Data correspond to usage on the plateform after 2015. The current usage metrics is available 48-96 hours after online publication and is updated daily on week days.
Initial download of the metrics may take a while.