Fig. 6
Download original image
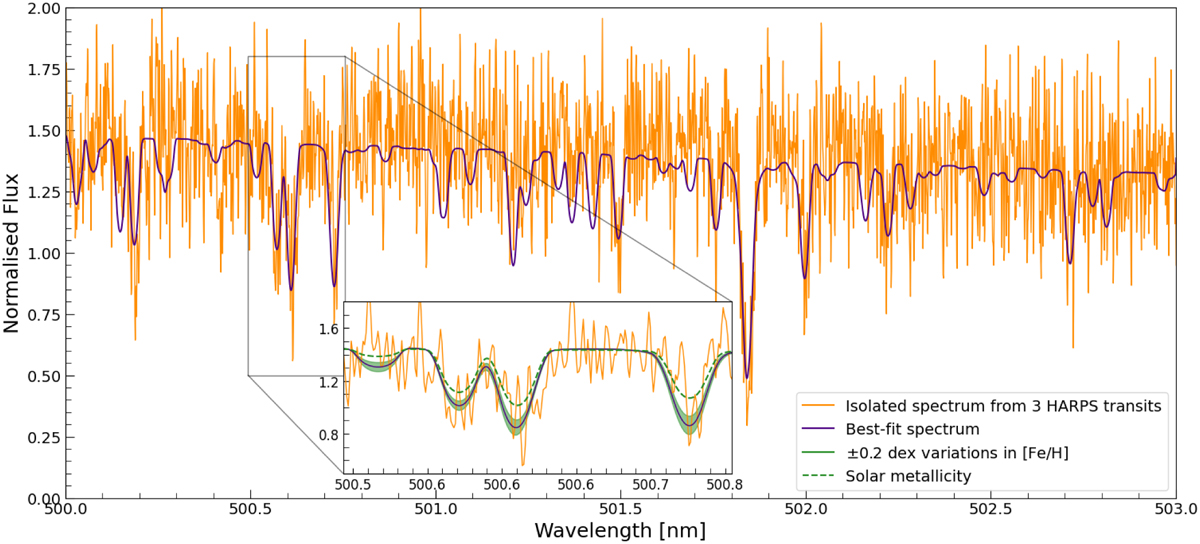
Average isolated spectrum, F*,N, calculated from three real HARPS transits (orange) and its corresponding best-fit spectrum (purple) with Teff and log g fixed to parameters from Lendl et al. (2020). The shaded green region in the inset indicates ±0.2 variations in metallicity, [Fe/H]. The dotted green line indicates the spectrum with solar metallicity, [Fe/H] = 0.
Current usage metrics show cumulative count of Article Views (full-text article views including HTML views, PDF and ePub downloads, according to the available data) and Abstracts Views on Vision4Press platform.
Data correspond to usage on the plateform after 2015. The current usage metrics is available 48-96 hours after online publication and is updated daily on week days.
Initial download of the metrics may take a while.