Fig. 4
Download original image
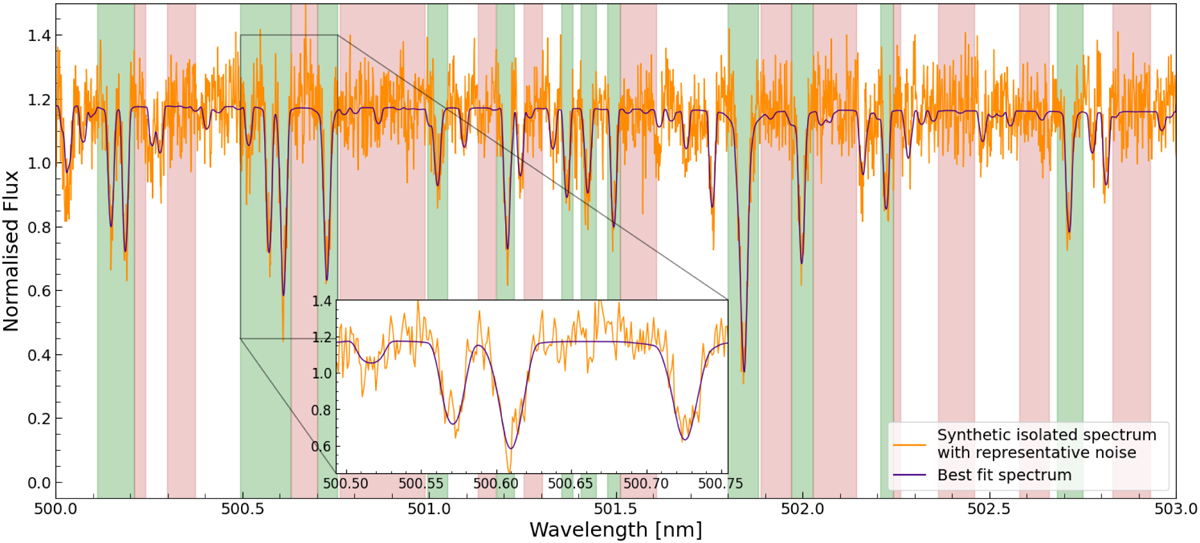
Example segment of the average isolated stellar spectrum, F*,N, from three WASP-189 b transits from a simulated HARPS observation (orange) with its best-fit spectrum (purple). The green shaded regions mark the pixels used for fitting various parameters and abundances. The red regions mark the pixels used for continuum fitting.
Current usage metrics show cumulative count of Article Views (full-text article views including HTML views, PDF and ePub downloads, according to the available data) and Abstracts Views on Vision4Press platform.
Data correspond to usage on the plateform after 2015. The current usage metrics is available 48-96 hours after online publication and is updated daily on week days.
Initial download of the metrics may take a while.