Open Access
Fig. 3
Download original image
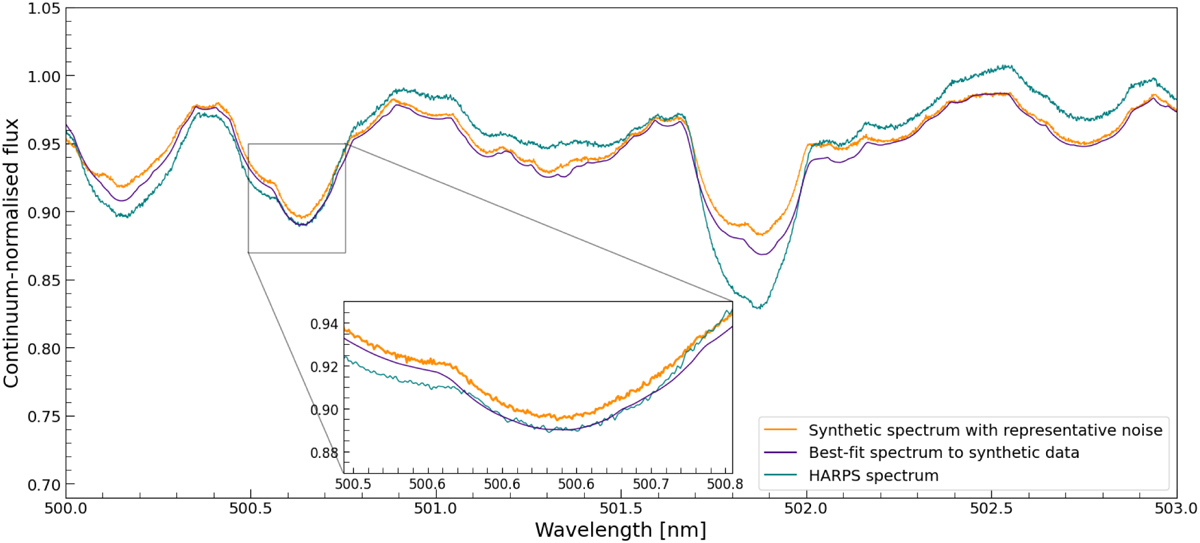
Example segment of the mean out-of-transit stellar spectrum of WASP-189 from 3 nights of simulated HARPS observations (orange) with its best-fit spectrum (purple). The real HARPS spectrum (green) has been included to show how the synthetically generated spectrum compares.
Current usage metrics show cumulative count of Article Views (full-text article views including HTML views, PDF and ePub downloads, according to the available data) and Abstracts Views on Vision4Press platform.
Data correspond to usage on the plateform after 2015. The current usage metrics is available 48-96 hours after online publication and is updated daily on week days.
Initial download of the metrics may take a while.