Fig. 2
Download original image
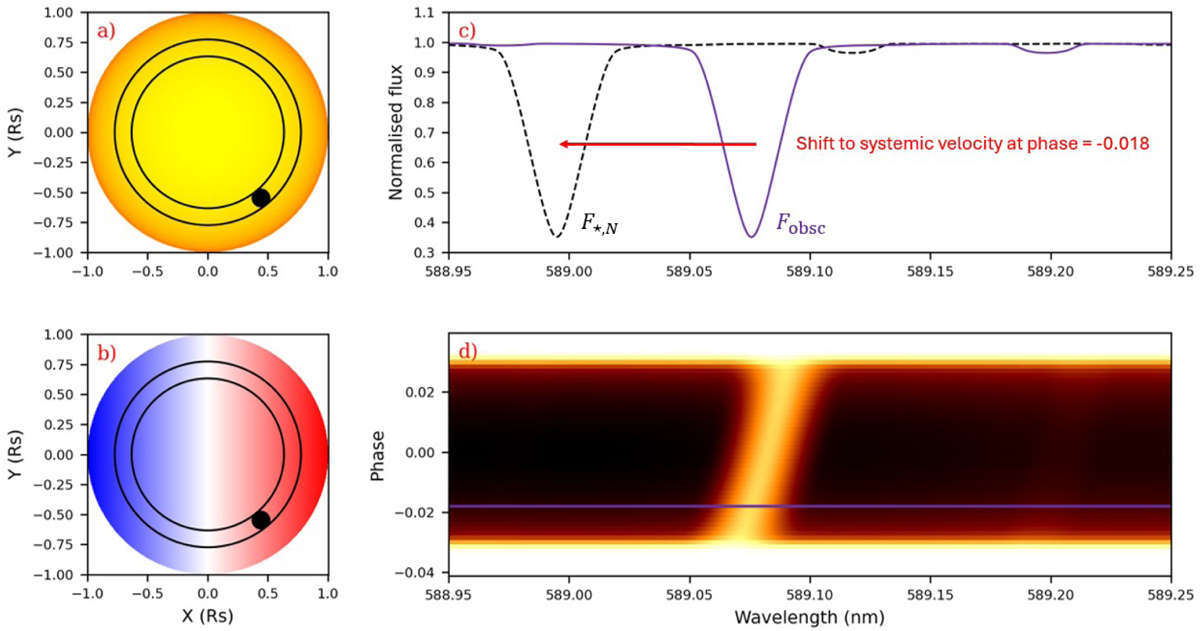
(Movie online) Model isolated spectrum from a single in-transit exposure of WASP-189 b at phase ϕ = −0.018. The spectrum has been cropped to show a single line of the Na doublet. Subfigures (a) and (b) show the position of the transiting planet at the current phase as a solid black circle over the star. The annulus of similar stellar composition is also indicated in these figures with solid black lines. The colour of the star in (a) represents limb-darkening, and (b) represents the rotation of the star, with the respective blue and red Doppler shifts. Subfigure (c) shows the momentary local obscured spectrum, Fobsc, in purple and the isolated spectrum, F*,N, with the dashed black line. (d) contains the time-series in-transit residuals, R, with the horizontal purple line indicating the current planetary orbital phase. The colours represent the flux level, with a greater flux being more yellow and a lower flux being darker. It is important to note that this residual spectrum is different from the extracted non-broadened spectrum above.
Current usage metrics show cumulative count of Article Views (full-text article views including HTML views, PDF and ePub downloads, according to the available data) and Abstracts Views on Vision4Press platform.
Data correspond to usage on the plateform after 2015. The current usage metrics is available 48-96 hours after online publication and is updated daily on week days.
Initial download of the metrics may take a while.