Fig. 7
Download original image
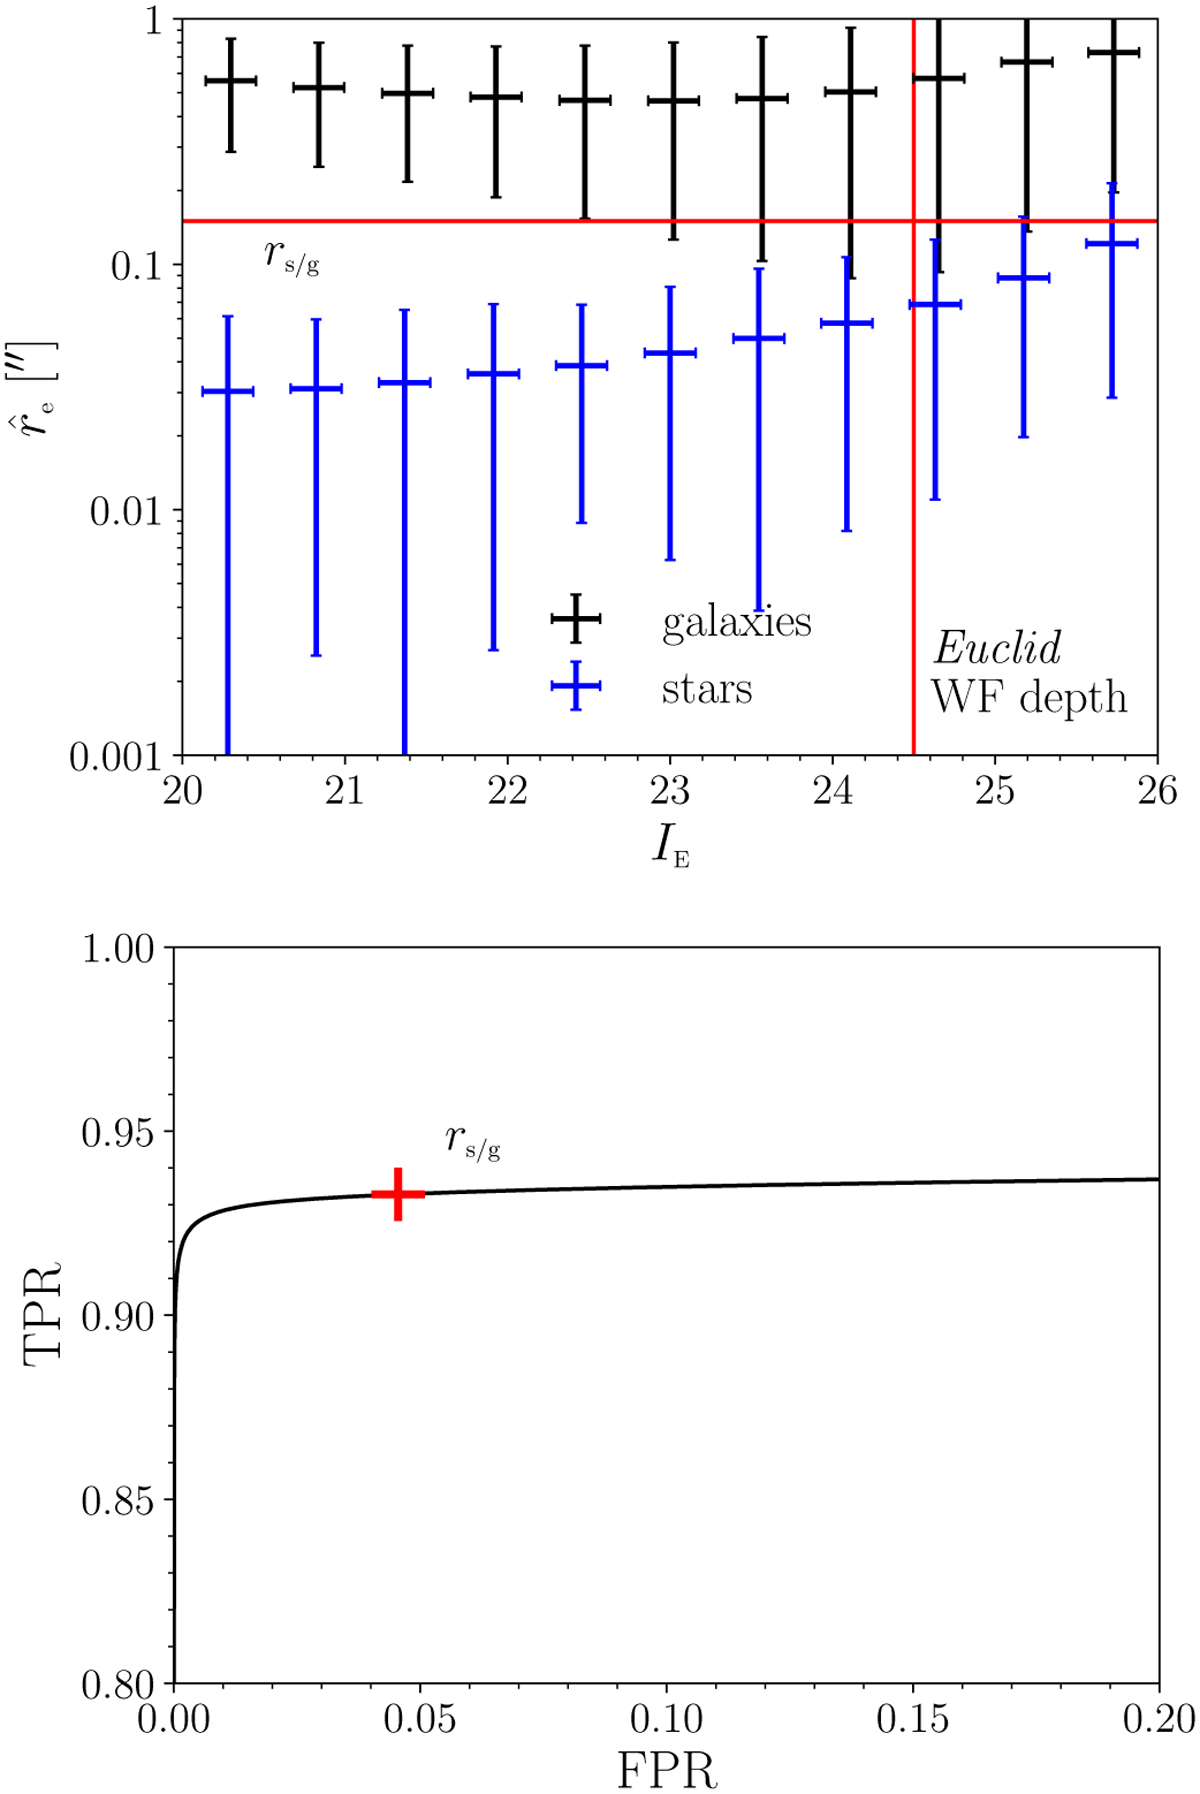
Star-galaxy separation of detected objects. (Top) Observed sizemagnitude distribution of true galaxies and stars. The data points are the mean of re as a function of IE . Also shown are the standard deviation of re and IE in each bin. rs/g = 0″.15 provides a good separation threshold working up to IE < 24. (Bottom) Operating curve showing where our threshold (indicated with a cross) sits in terms of true positives (92.9%) and false positives (4.3%). The area under the operating curve is large, and the curve itself is reasonably flat for a wide range of false positive rate suggesting excellent discrimination and weak sensitivity on the threshold (the shear bias does not appreciably change). In real measurements this could be further optimised through access to external data or simulations.
Current usage metrics show cumulative count of Article Views (full-text article views including HTML views, PDF and ePub downloads, according to the available data) and Abstracts Views on Vision4Press platform.
Data correspond to usage on the plateform after 2015. The current usage metrics is available 48-96 hours after online publication and is updated daily on week days.
Initial download of the metrics may take a while.