Fig. C.2
Download original image
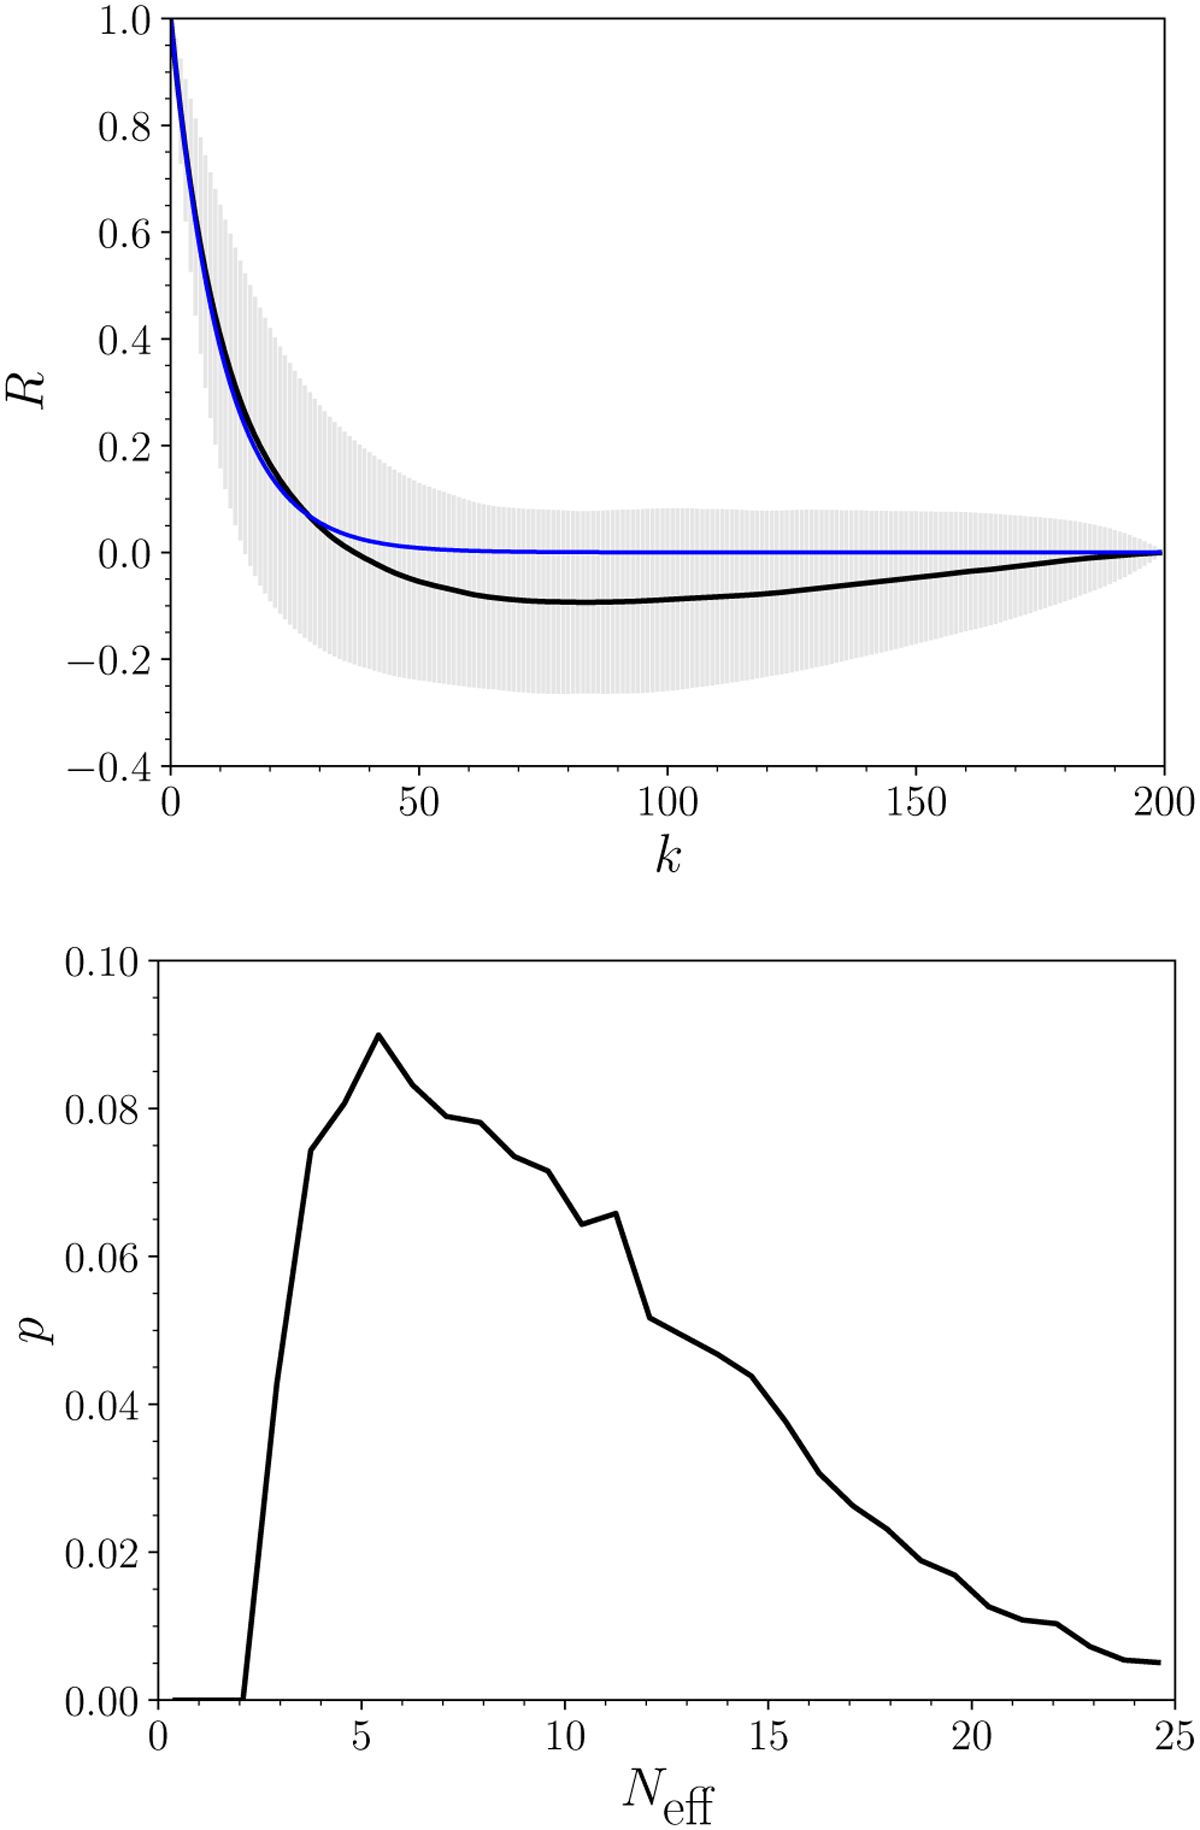
(Top) Sample autocorrelation function of the same ellipticity chains as shown in Fig. C.1. The function dies off rapidly approximately as an exponential decay (shown as the analytic curve without error bands) with the same autocorrelation time. A small negative correlation at large lags is an indicator of fast convergence. (Bottom) Distribution of effective sample size for the same chains, whose mean is at about 14 (compare with NMC = 200).
Current usage metrics show cumulative count of Article Views (full-text article views including HTML views, PDF and ePub downloads, according to the available data) and Abstracts Views on Vision4Press platform.
Data correspond to usage on the plateform after 2015. The current usage metrics is available 48-96 hours after online publication and is updated daily on week days.
Initial download of the metrics may take a while.