Open Access
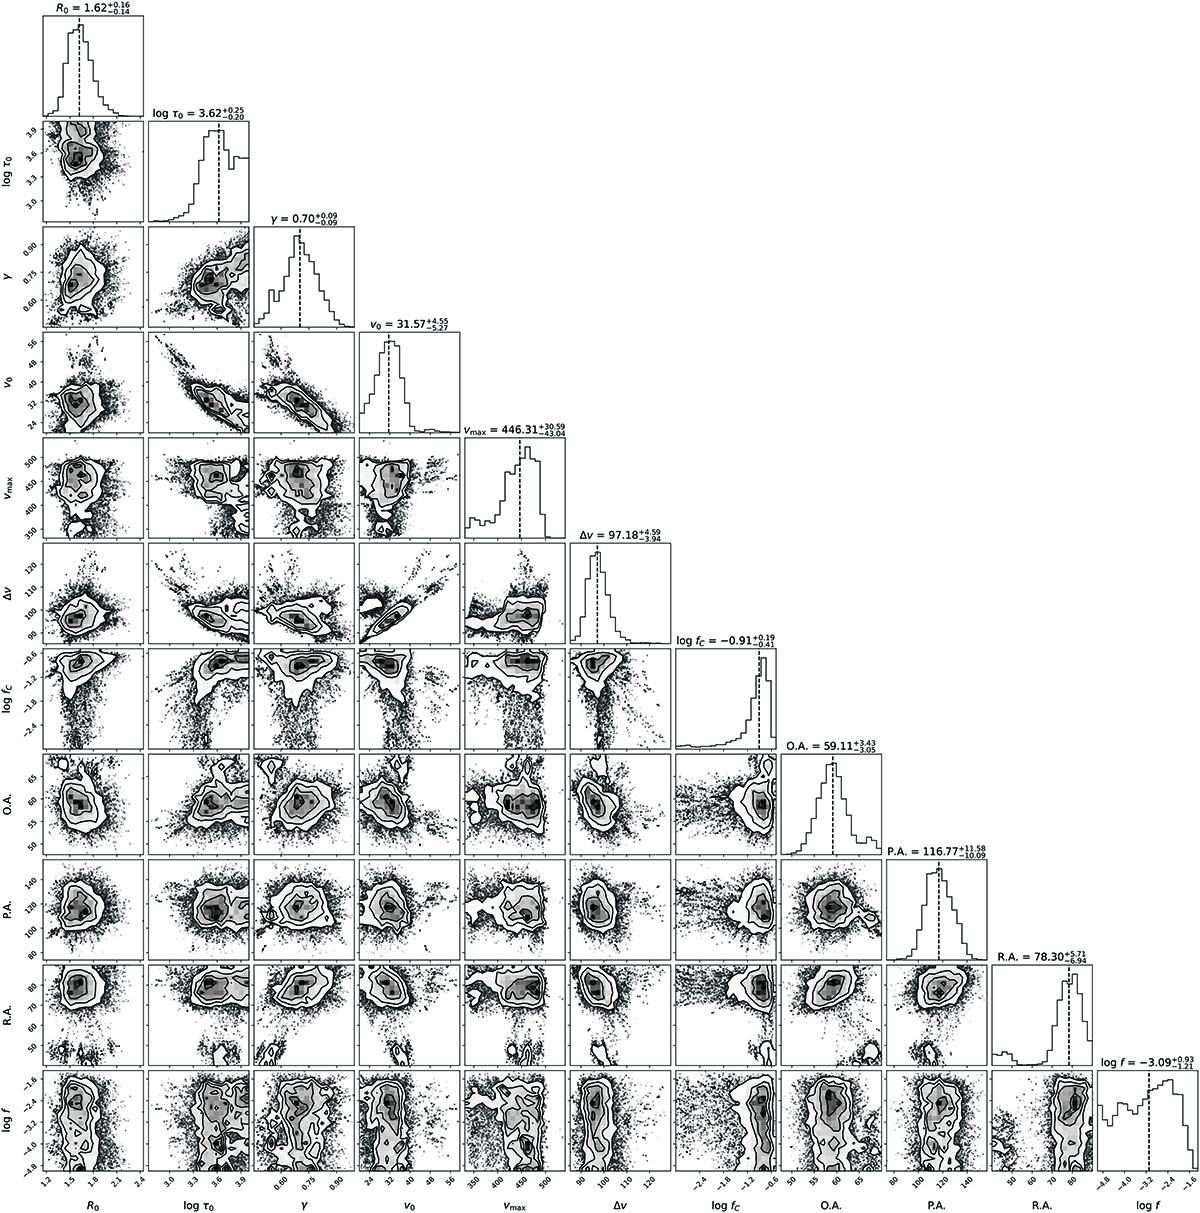
Fig. 9.
Download original image
Posterior distributions of each one of the model parameters described in Sect. 5 and their respective covariance. The median value of each posterior distribution is indicated in the top panels. The uncertainties show the percentiles 32 and 68 of the distribution.
Current usage metrics show cumulative count of Article Views (full-text article views including HTML views, PDF and ePub downloads, according to the available data) and Abstracts Views on Vision4Press platform.
Data correspond to usage on the plateform after 2015. The current usage metrics is available 48-96 hours after online publication and is updated daily on week days.
Initial download of the metrics may take a while.