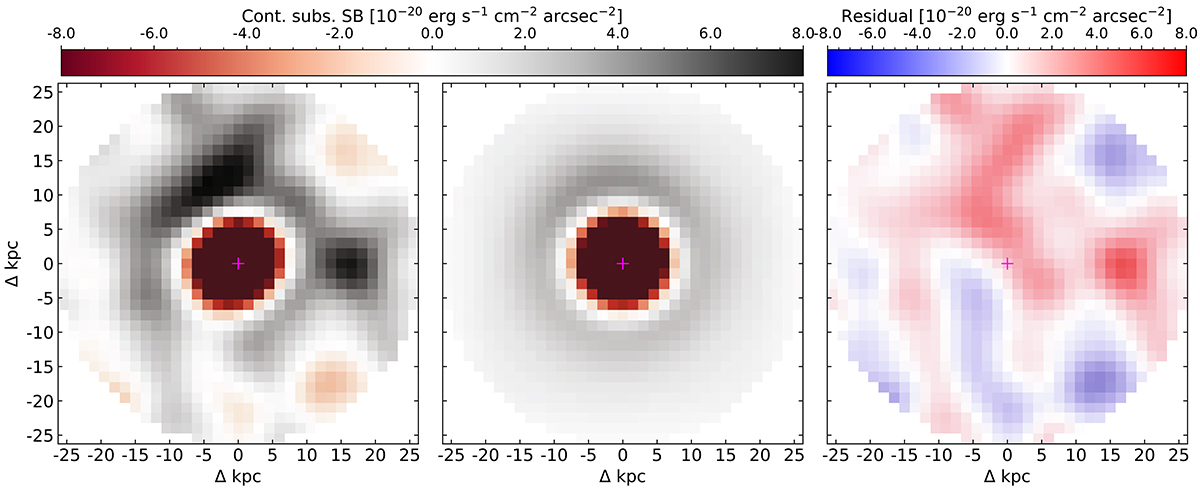
Fig. 8.
Download original image
Comparison of the pseudo-narrowband images convolved with a Gaussian of 1″ FWHM, computed for the MUSE data cube (left) and the best-fitting model cube (center), collapsing the Mg II wavelength range, after subtracting the continuum from both cubes, for the full modeled FoV. The residuals are shown in the right panel. The magenta cross indicates the center of the FoV for reference. There is a good qualitative agreement between the images, with each displaying an absorption-dominated center, shown in red, and a more spatially extended halo of emission Mg II emission, shown in gray colors. However, there are also clear differences in the morphology and strength of the Mg II emission.
Current usage metrics show cumulative count of Article Views (full-text article views including HTML views, PDF and ePub downloads, according to the available data) and Abstracts Views on Vision4Press platform.
Data correspond to usage on the plateform after 2015. The current usage metrics is available 48-96 hours after online publication and is updated daily on week days.
Initial download of the metrics may take a while.