Fig. 6.
Download original image
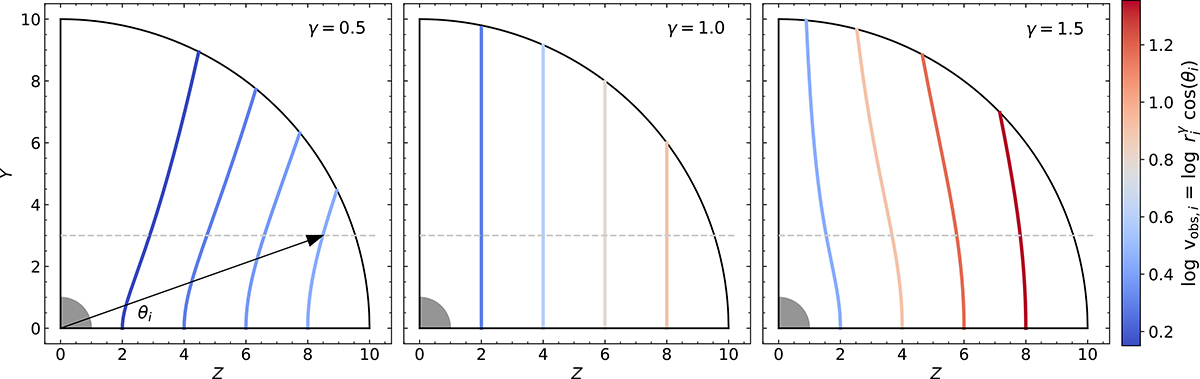
Isovelocity curves in the spherical outflow model. The curves were calculated following Eq. (3) for three different values of γ, setting R0 and v0 to 1. The observer sits far away from the object toward the positive z-direction. The gray dashed line represents an arbitrary line of sight. Due to projection effects, the observed velocity of each spherical shell (vobs) corresponds to the velocity component parallel to the line of sight, and will be smaller than its intrinsic velocity (except for an impact parameter of zero, in which case they are the same). Thus, vobs for a given spherical shell depends on the impact parameter of the line of sight, and the angle θ between the intersection of the spherical shell with the line of sight, and the z-axis (i.e., a higher θ implies that a lower fraction of the intrinsic radial velocity is parallel to the line of sight). The isovelocity surfaces are defined as the set of points within the outflow for which the observed velocity is identical, due to projection effects. Different values of γ lead to different shapes of the isovelocity curves. In particular, γ = 1 leads to perfectly vertical surfaces, meaning that the increase in radius (and thus, velocity) by moving upward in the y direction is exactly compensated by the decrease in cos(θ), that is, a smaller fraction of the intrinsic velocity of the spherical shell is parallel to the line of sight, causing the projected velocity to remain unchanged. The most relevant aspect is that the isovelocity curves do not cross each other, implying that any line of sight intersects each isovelocity curve only once. Ultimately, the consequence of this is that for any arbitrary line of sight, different observed velocities map specific unique locations within the outflow (in the z direction). This bijective relation between the velocity and physical space allows us to probe the outflow properties on a 3D basis provided that we have sight lines for different locations in the x − y plane (i.e., integral field data).
Current usage metrics show cumulative count of Article Views (full-text article views including HTML views, PDF and ePub downloads, according to the available data) and Abstracts Views on Vision4Press platform.
Data correspond to usage on the plateform after 2015. The current usage metrics is available 48-96 hours after online publication and is updated daily on week days.
Initial download of the metrics may take a while.