Fig. B.1.
Download original image
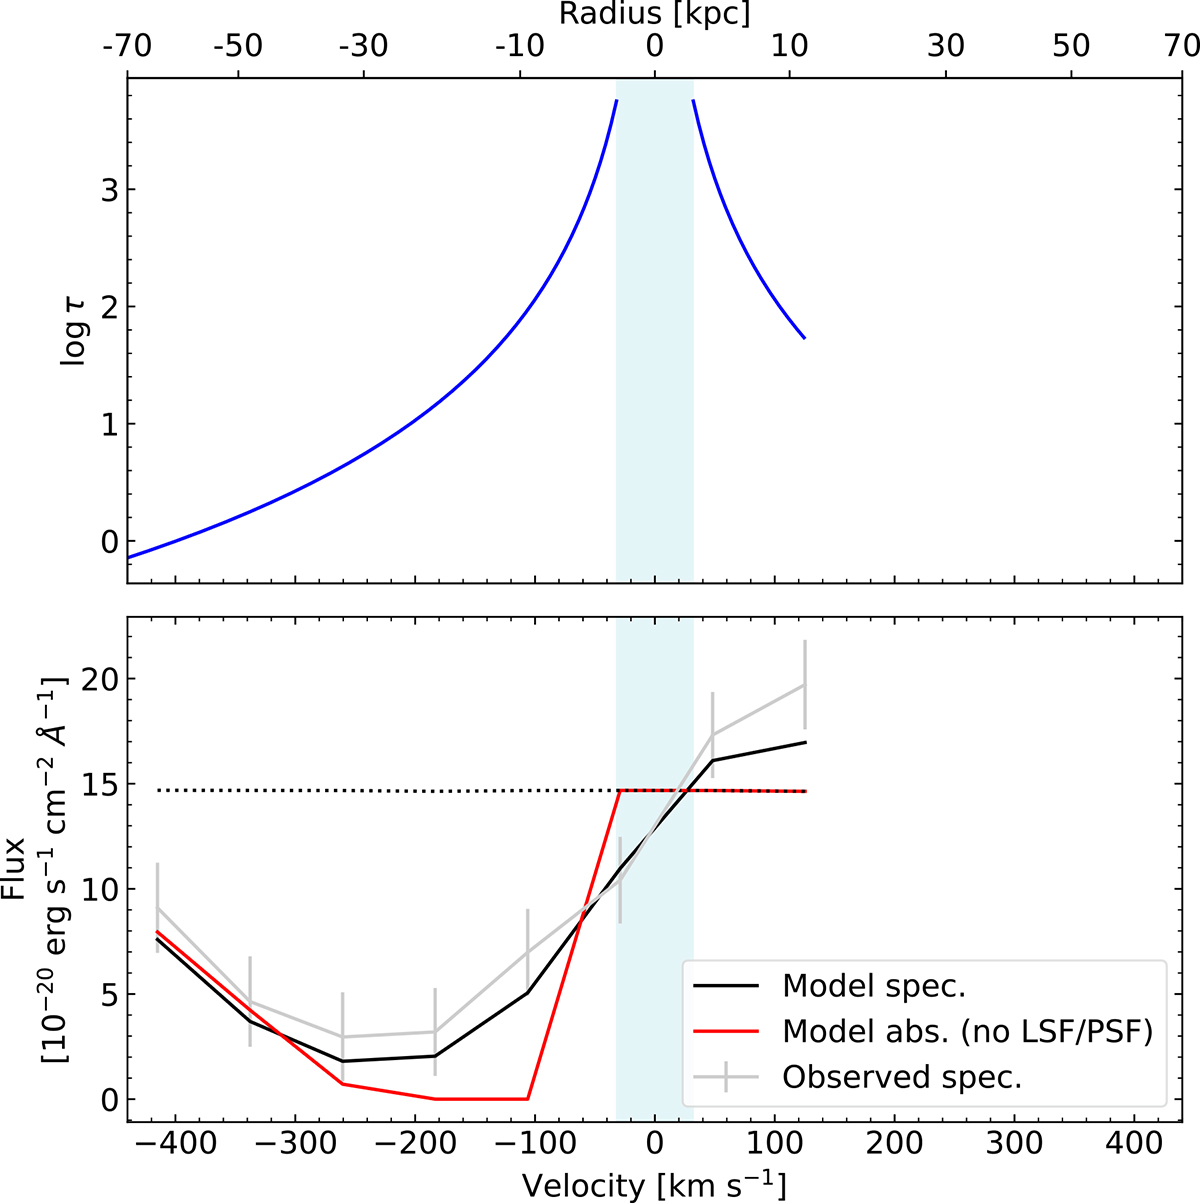
Relation between radius, velocity, flux, and optical depth, for the spectrum of the central spaxel of the model and data cubes, for the best-fitting parameters determined in Sect. 7.1. Top panel shows how the optical depth τ is higher in the central region of the outflow, and decreases toward larger radii. The light blue area marks the region where radius < R0. The bottom panel shows the spectrum that results from the τ radial gradient shown above. The absorption is strongest closer to zero velocity, where the optical depth is higher, and then its strength decreases toward more negative velocity, that correspond to larger radii and lower optical depths. Within the light blue band there is no outflow and hence no absorption. The figure shows the spectrum of only the Mg IIλ2796 transition, and the red wing of the emission line is truncated to not include wavelength channels where the absorption of the Mg IIλ2803 transition becomes relevant, making more difficult the interpretation of the figure.
Current usage metrics show cumulative count of Article Views (full-text article views including HTML views, PDF and ePub downloads, according to the available data) and Abstracts Views on Vision4Press platform.
Data correspond to usage on the plateform after 2015. The current usage metrics is available 48-96 hours after online publication and is updated daily on week days.
Initial download of the metrics may take a while.