Fig. 12.
Download original image
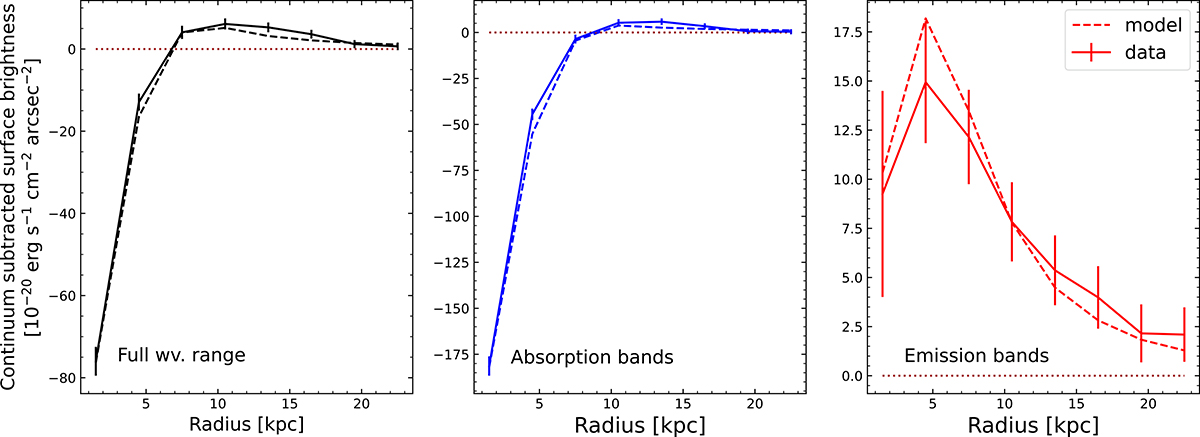
Radial profiles of the Mg II surface brightness measured for the absorption (blue) and emission (red) dominated bands, defined in the top-left panel of Fig. 10, as well as for the full wavelength range (i.e., total absorption plus emission), for the data cube (solid lines) and best-fitting model cube (dashed lines). The brown dashed line indicates the zero level (i.e., continuum surface brightness). The model reproduces several key features of the radial profiles, such as a similar depth in the absorption in the central region, and a decrease in the emission profile toward outer radii generally consistent within the error bars, with a peak at around ∼5 kpc from the central galaxy.
Current usage metrics show cumulative count of Article Views (full-text article views including HTML views, PDF and ePub downloads, according to the available data) and Abstracts Views on Vision4Press platform.
Data correspond to usage on the plateform after 2015. The current usage metrics is available 48-96 hours after online publication and is updated daily on week days.
Initial download of the metrics may take a while.