Open Access
Fig. 11.
Download original image
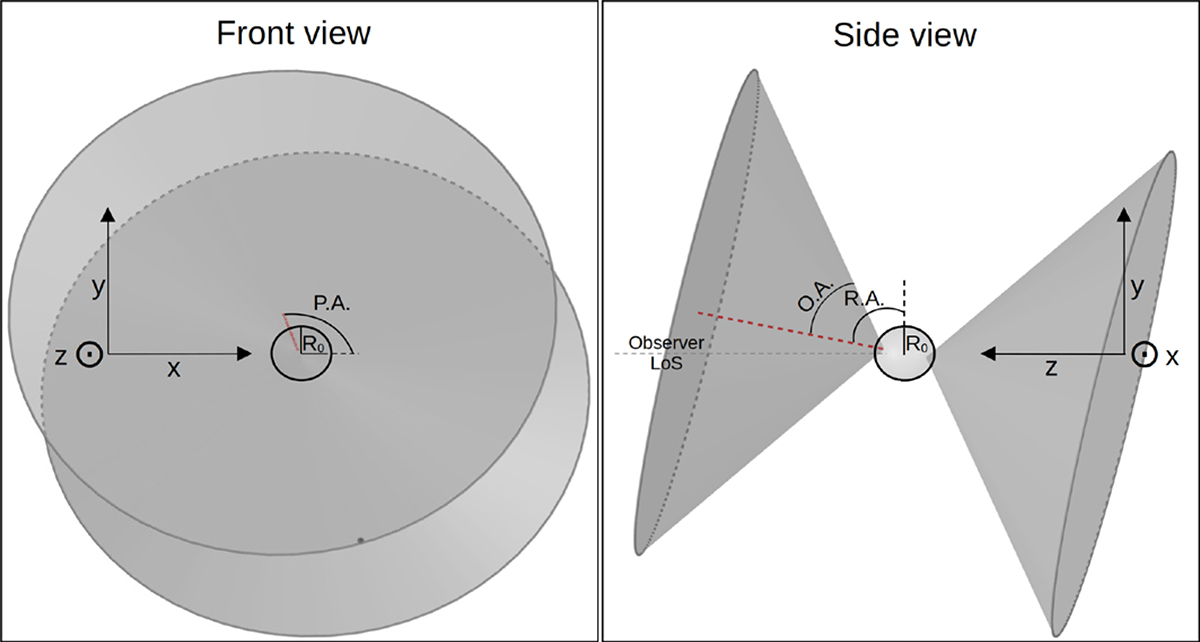
Schematic representation of the geometry of our best-fitting outflow model, with OA = 59°, PA = 120°, and RA = 80°, as described in Sect. 7.1. The red dashed line indicates the cone axis. The observer is located at a large positive z value.
Current usage metrics show cumulative count of Article Views (full-text article views including HTML views, PDF and ePub downloads, according to the available data) and Abstracts Views on Vision4Press platform.
Data correspond to usage on the plateform after 2015. The current usage metrics is available 48-96 hours after online publication and is updated daily on week days.
Initial download of the metrics may take a while.