Fig. 10.
Download original image
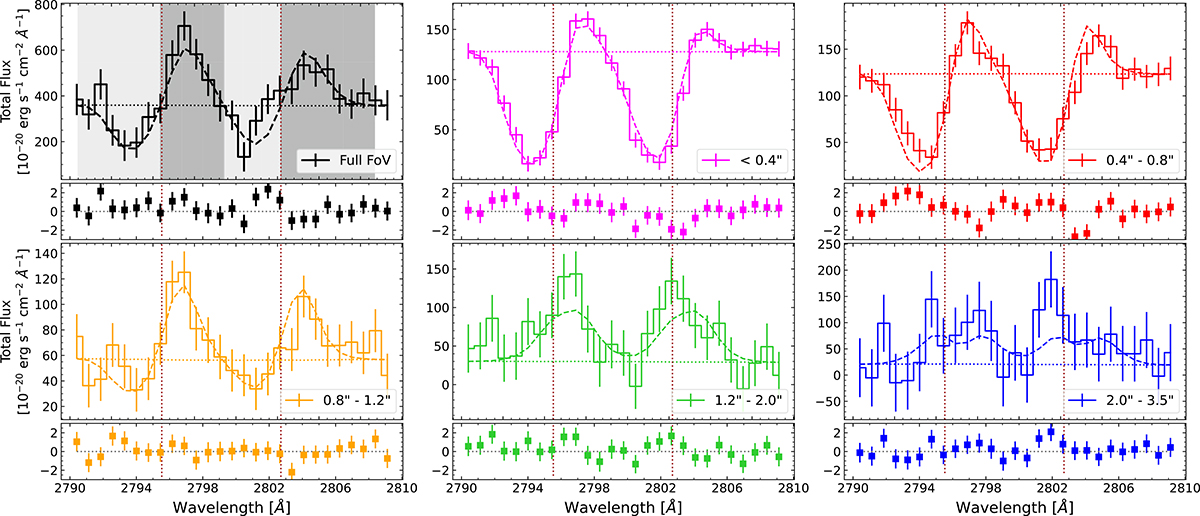
Rest-frame spectra extracted from five ring-like apertures as well as from the full modeled FoV for the data cube (solid lines) and the best-fitting model cube (dashed lines). The labels in each panel indicate the inner and outer radii of each ring-like aperture (except the innermost, circular aperture, which is defined by a single radius). In the frame of reference of the central galaxy, the apertures represent physical sizes of < 3 kpc, 3 − 6 kpc, 6 − 9 kpc, 9 − 15 kpc, and 15 − 26 kpc. The nearly horizontal dotted lines show the continuum level for each aperture. The vertical dotted lines indicate the rest-frame wavelength of the Mg II doublet. The smaller panels show the residuals of the model, normalized by the median standard deviation of the spectra extracted from each aperture. That is, a residual of 1 indicates one sigma difference between the data and the model. Our outflow modeling scheme reproduces the Mg II emission and absorption profiles relatively well. The top-left panel shows in gray colors the absorption- and emission-dominated bands (light gray and dark gray, respectively), defined by the wavelengths where the full FoV model intersects the continuum. We use these bands to produce emission- and absorption-narrowband images that we analyze in Sect. 7.3.
Current usage metrics show cumulative count of Article Views (full-text article views including HTML views, PDF and ePub downloads, according to the available data) and Abstracts Views on Vision4Press platform.
Data correspond to usage on the plateform after 2015. The current usage metrics is available 48-96 hours after online publication and is updated daily on week days.
Initial download of the metrics may take a while.