Open Access
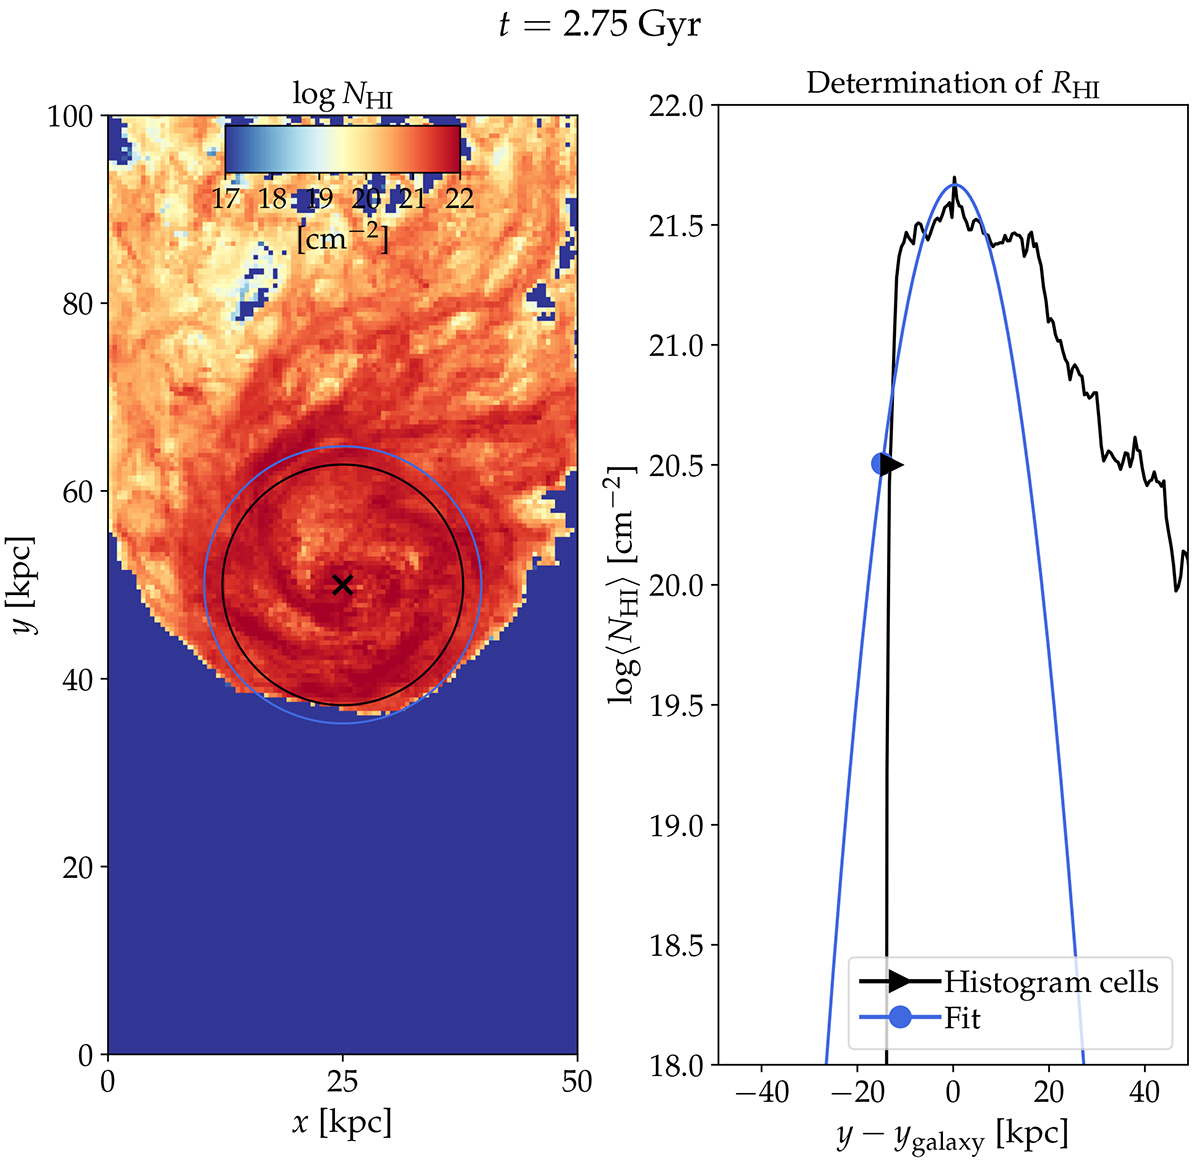
Fig. B.2.
Download original image
Same as Fig. B.1 but for a time of t = 2.75 Gyr, where we instead of fitting the averaged column density with a parabola simply determine the furthest upstream location with ⟨NHI⟩≥1020.5 cm−2 (see black triangle). This approach is sufficient and preferred at times, where HI clumps in the CGM upstream the galaxy are absent.
Current usage metrics show cumulative count of Article Views (full-text article views including HTML views, PDF and ePub downloads, according to the available data) and Abstracts Views on Vision4Press platform.
Data correspond to usage on the plateform after 2015. The current usage metrics is available 48-96 hours after online publication and is updated daily on week days.
Initial download of the metrics may take a while.