Fig. B.1.
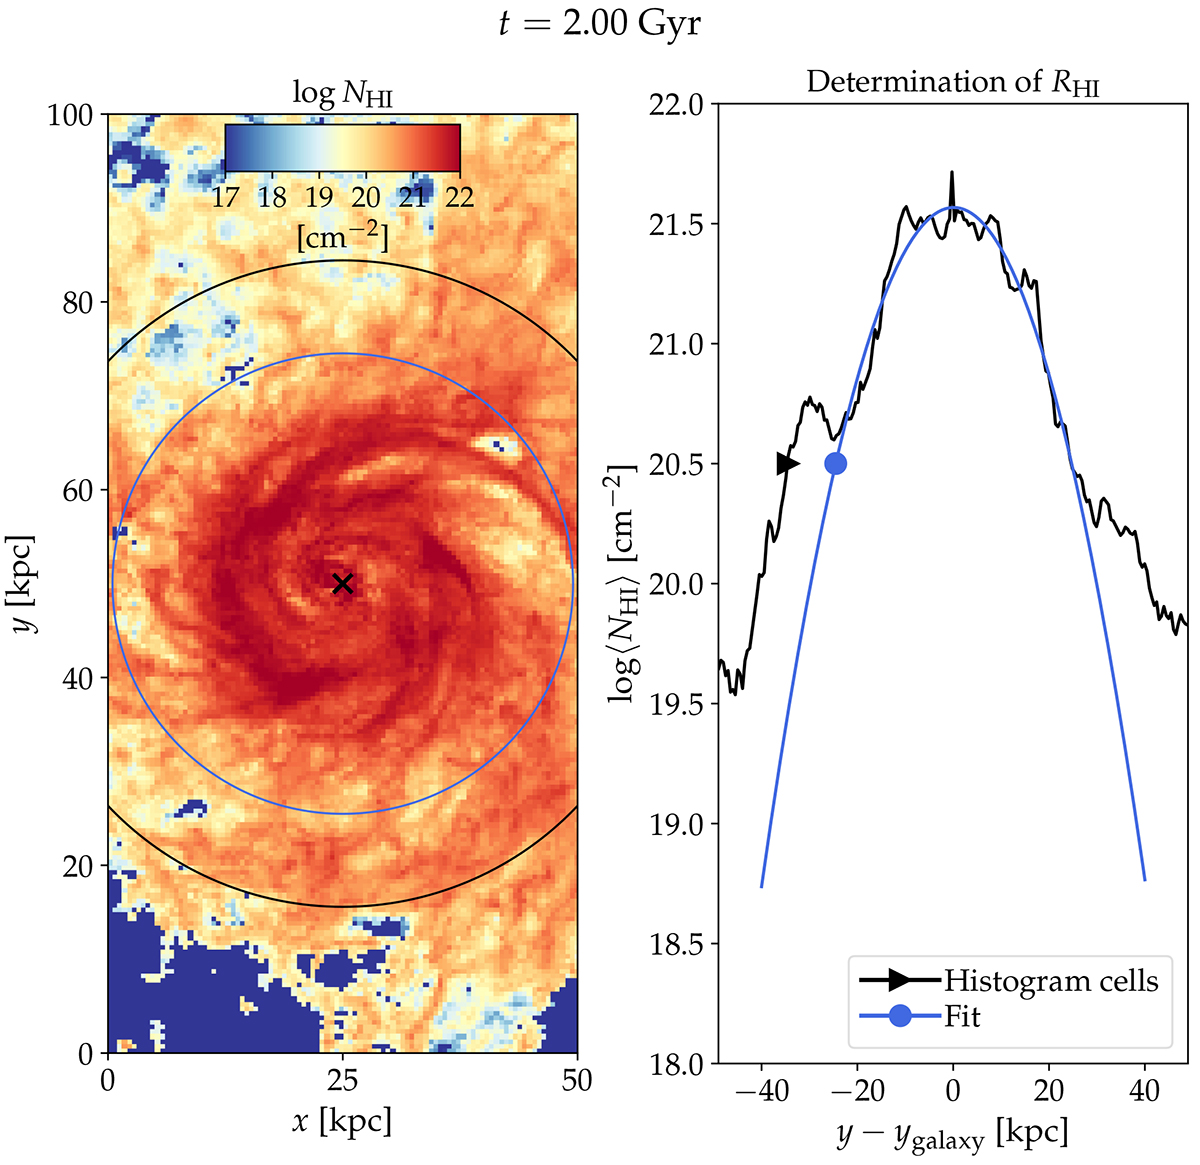
Download original image
HI projected column density of the jellyfish galaxy (left panel), where the cross marks the galaxy centre, and the blue triangle and black circle mark RHI determined with a fit and by identifying the furthest upstream location with ⟨NHI⟩≥1020.5 cm−2, respectively. In the right panel, we plot ⟨NHI⟩ (see text for details) and mark RHI determined with the different methods. At this early time of t = 2.0 Gyr, there are CGM clumps upstream from the galaxy, so we use a fit to determine the RHI for the disc.
Current usage metrics show cumulative count of Article Views (full-text article views including HTML views, PDF and ePub downloads, according to the available data) and Abstracts Views on Vision4Press platform.
Data correspond to usage on the plateform after 2015. The current usage metrics is available 48-96 hours after online publication and is updated daily on week days.
Initial download of the metrics may take a while.