Fig. 7.
Download original image
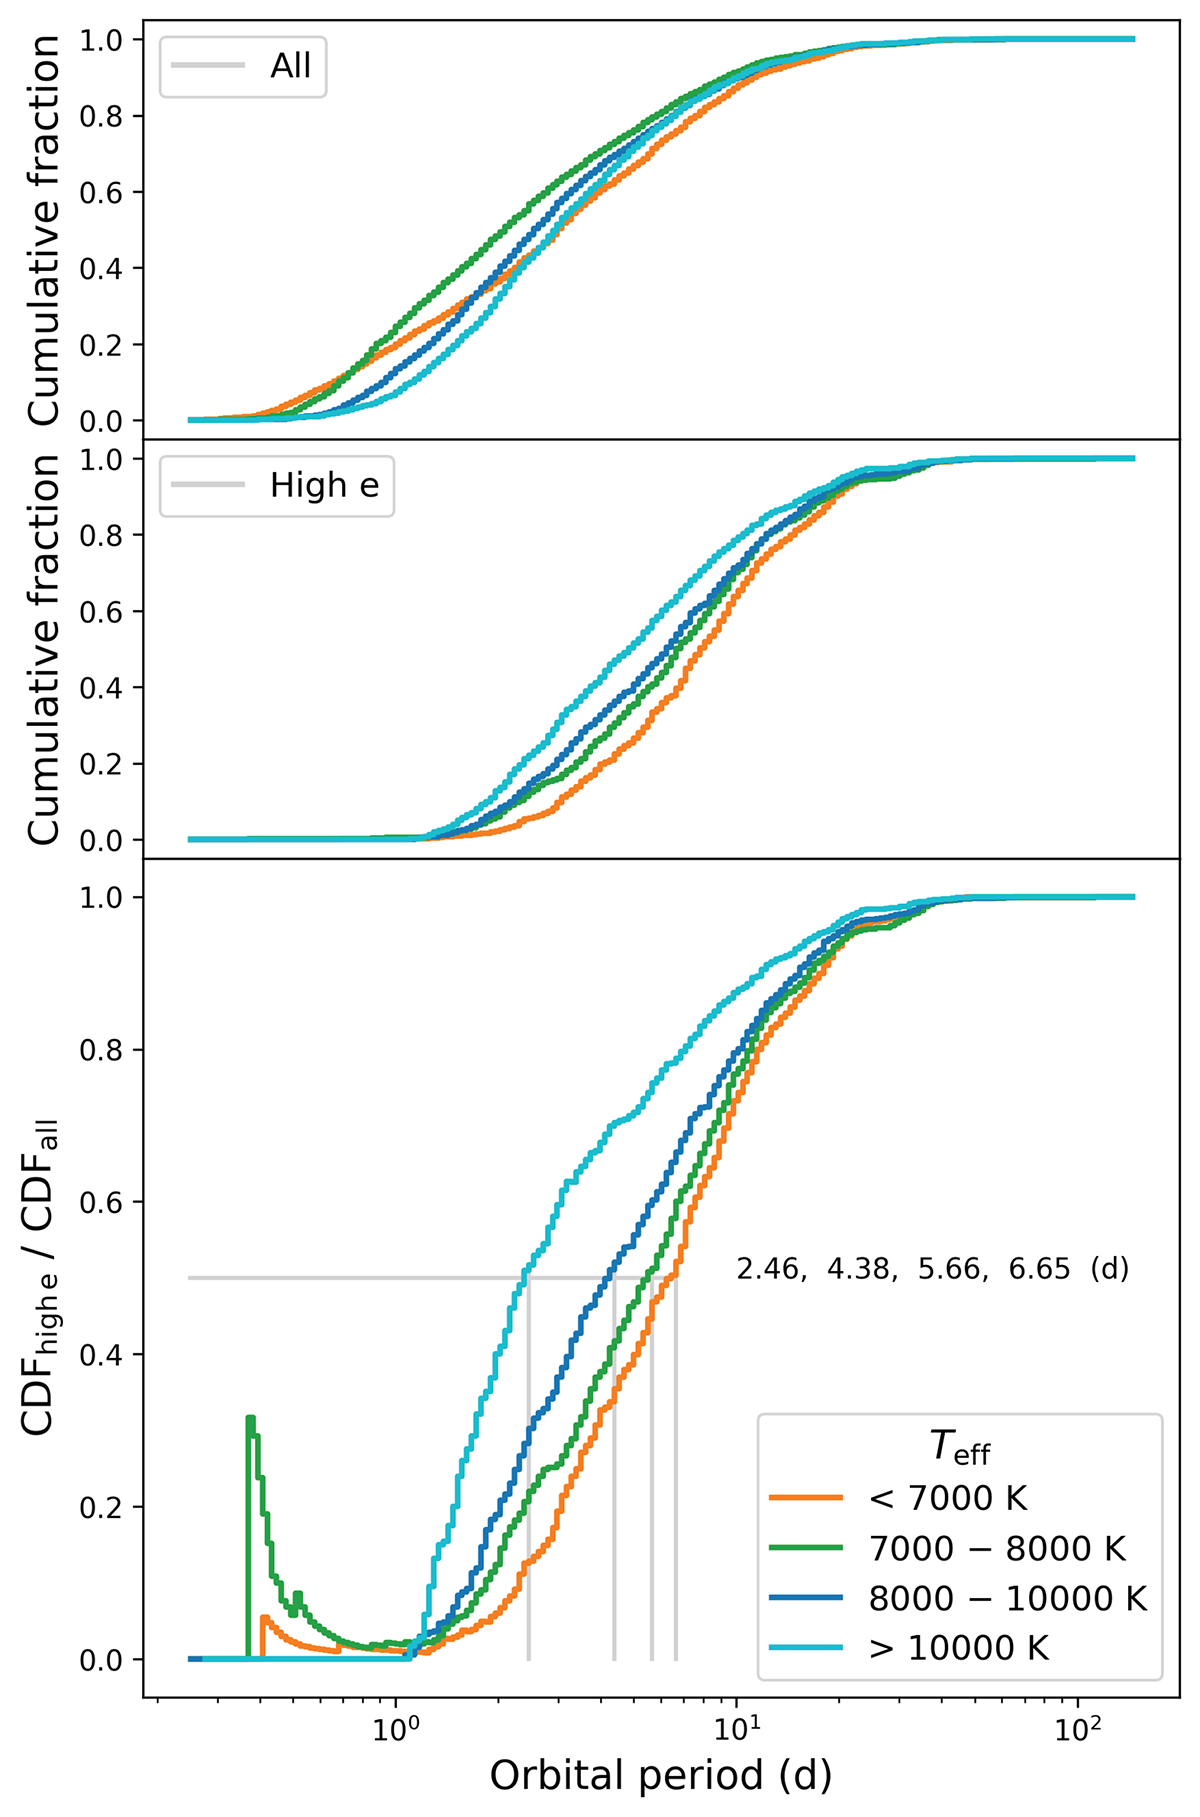
Cumulative distributions of period and their ratio for each temperature bin. The top panel is the CDF over all systems, in the middle is the CDF for eccentric systems and the bottom shows the ratio of the CDF for high eccentricity and the CDF for all systems. Measurements of the period at a fraction of 0.5 are indicated in the plot.
Current usage metrics show cumulative count of Article Views (full-text article views including HTML views, PDF and ePub downloads, according to the available data) and Abstracts Views on Vision4Press platform.
Data correspond to usage on the plateform after 2015. The current usage metrics is available 48-96 hours after online publication and is updated daily on week days.
Initial download of the metrics may take a while.