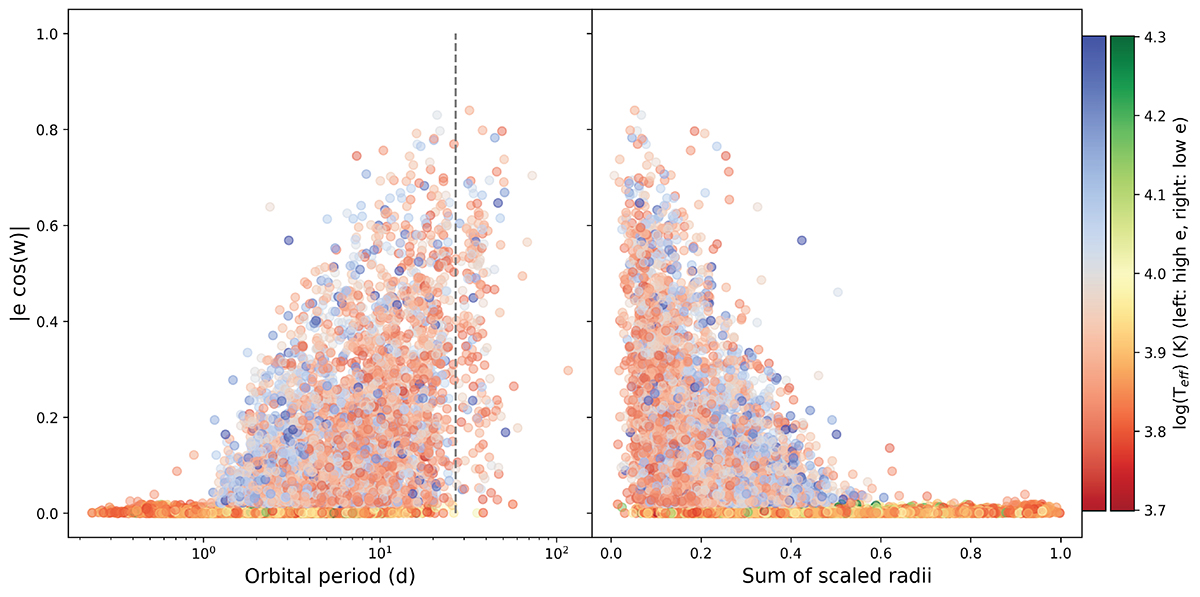
Fig. 6.
Download original image
Tangential component of eccentricity as a function of orbital period and sum of scaled radii. Effective temperatures are indicated by the colour gradient. The grey dashed line indicates the dip in the orbital period distribution at 27 days. Systems with high and low eccentricity are shaded with different colour maps (left and right colour bars, respectively).
Current usage metrics show cumulative count of Article Views (full-text article views including HTML views, PDF and ePub downloads, according to the available data) and Abstracts Views on Vision4Press platform.
Data correspond to usage on the plateform after 2015. The current usage metrics is available 48-96 hours after online publication and is updated daily on week days.
Initial download of the metrics may take a while.