Fig. B.2.
Download original image
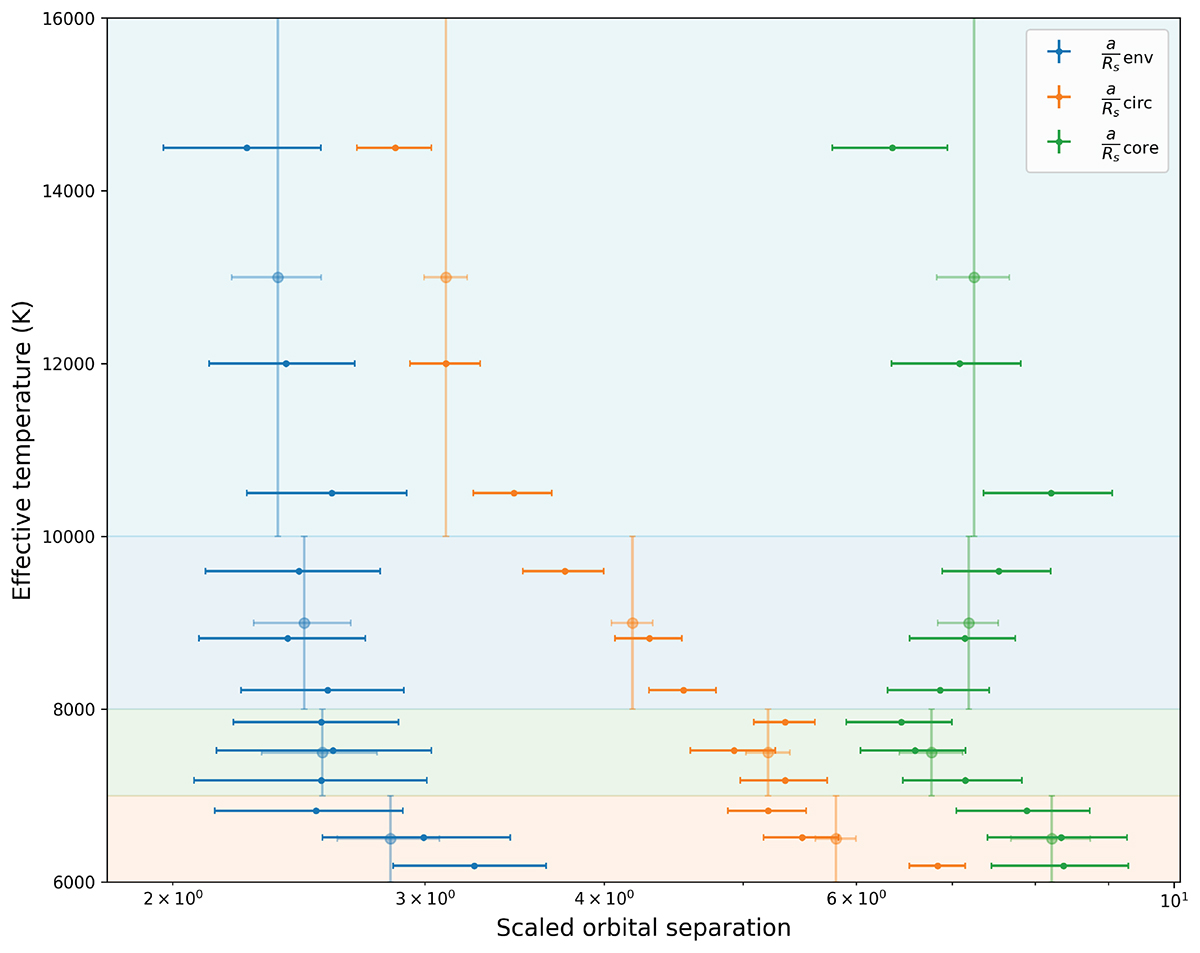
Visualisation of critical scaled orbital separation measurements in each temperature range. The colour of the shaded areas corresponds to the four main temperature domains, as do the vertical bars on the associated, lighter-coloured measurement points. The points with only horizontal error bars correspond to the effective temperature subdivisions and are plotted in the centre of the range.
Current usage metrics show cumulative count of Article Views (full-text article views including HTML views, PDF and ePub downloads, according to the available data) and Abstracts Views on Vision4Press platform.
Data correspond to usage on the plateform after 2015. The current usage metrics is available 48-96 hours after online publication and is updated daily on week days.
Initial download of the metrics may take a while.