Open Access
Fig. 10.
Download original image
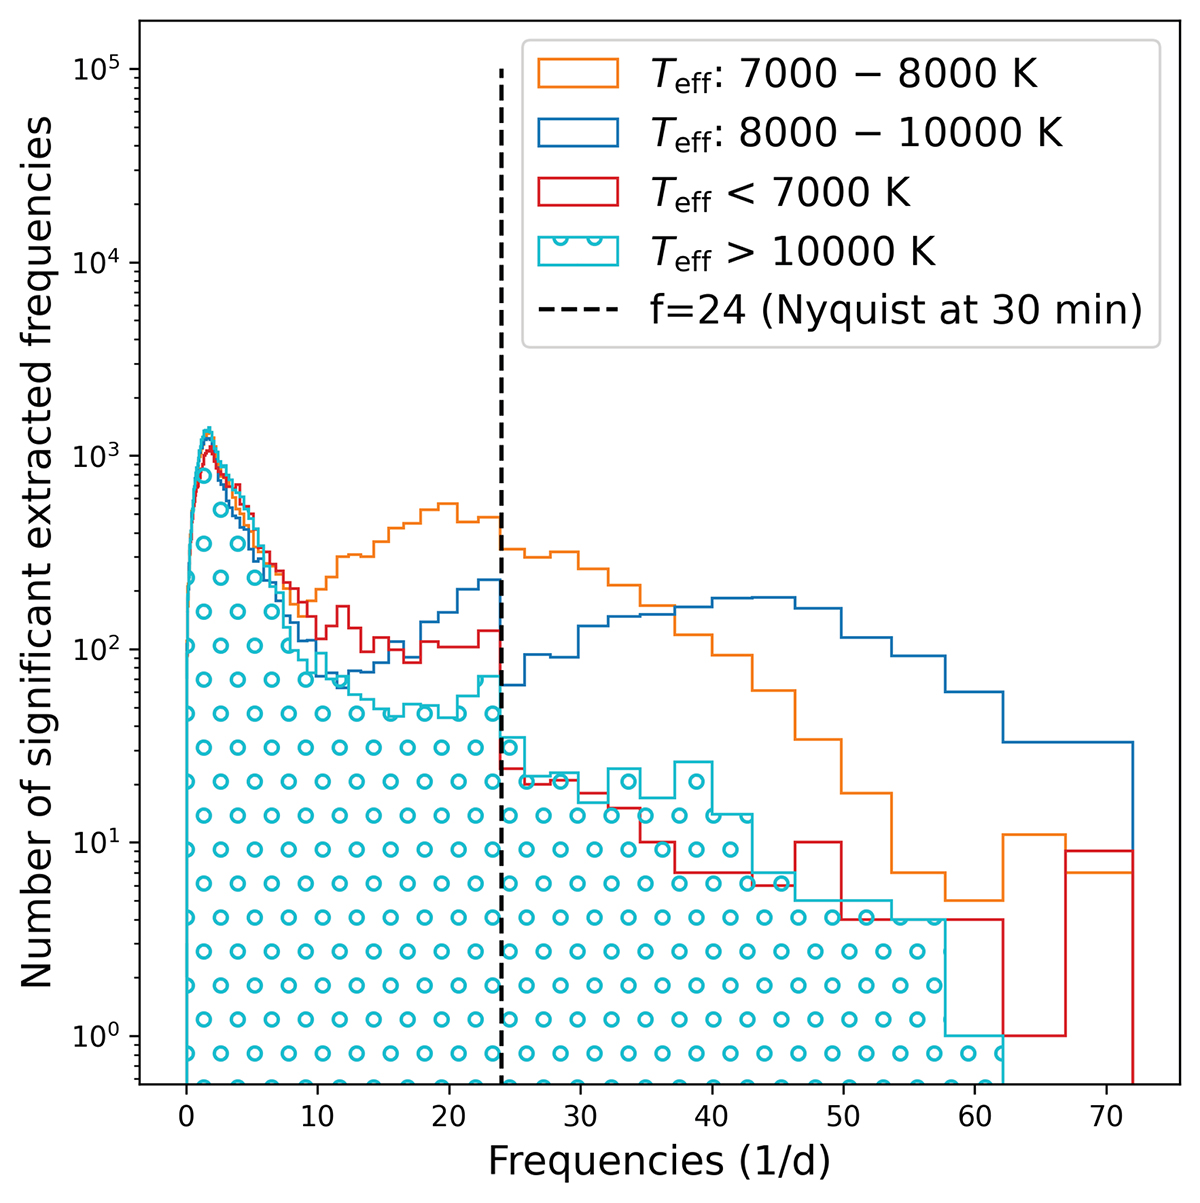
Histogram of the extracted significant frequencies in each temperature range. Bins are scaled logarithmically in size to better view the lower densities at high frequency. Included are all targets in the groups of p-mode pulsators and g-mode pulsators.
Current usage metrics show cumulative count of Article Views (full-text article views including HTML views, PDF and ePub downloads, according to the available data) and Abstracts Views on Vision4Press platform.
Data correspond to usage on the plateform after 2015. The current usage metrics is available 48-96 hours after online publication and is updated daily on week days.
Initial download of the metrics may take a while.