Fig. 9
Download original image
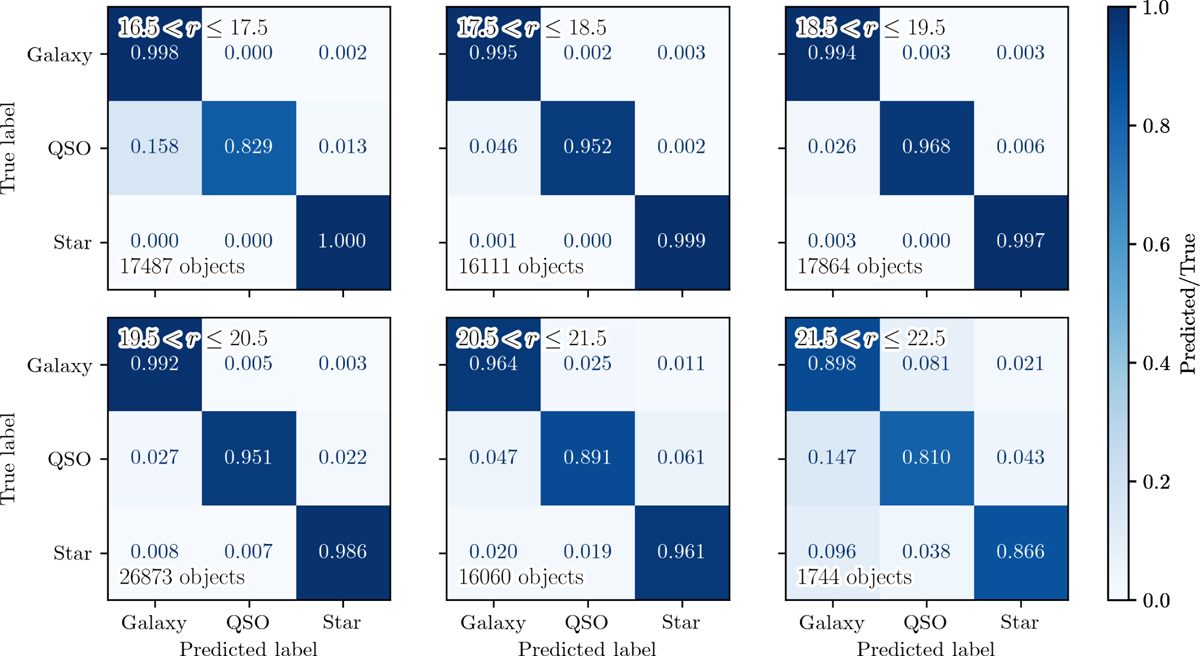
Confusion matrices depicting the correlation between the true classes and the predicted classes for objects in the test sample across different magnitude bins. These bins range from r = 16.5 to r = 22.5 mag in 1 mag increments, totaling six bins. The proportion of objects within each bin relative to the true class is indicated by varying shades of blue, with values represented by real numbers within the interval [0, 1]. Additionally, the confusion matrices include the count of objects contributing to each calculation.
Current usage metrics show cumulative count of Article Views (full-text article views including HTML views, PDF and ePub downloads, according to the available data) and Abstracts Views on Vision4Press platform.
Data correspond to usage on the plateform after 2015. The current usage metrics is available 48-96 hours after online publication and is updated daily on week days.
Initial download of the metrics may take a while.