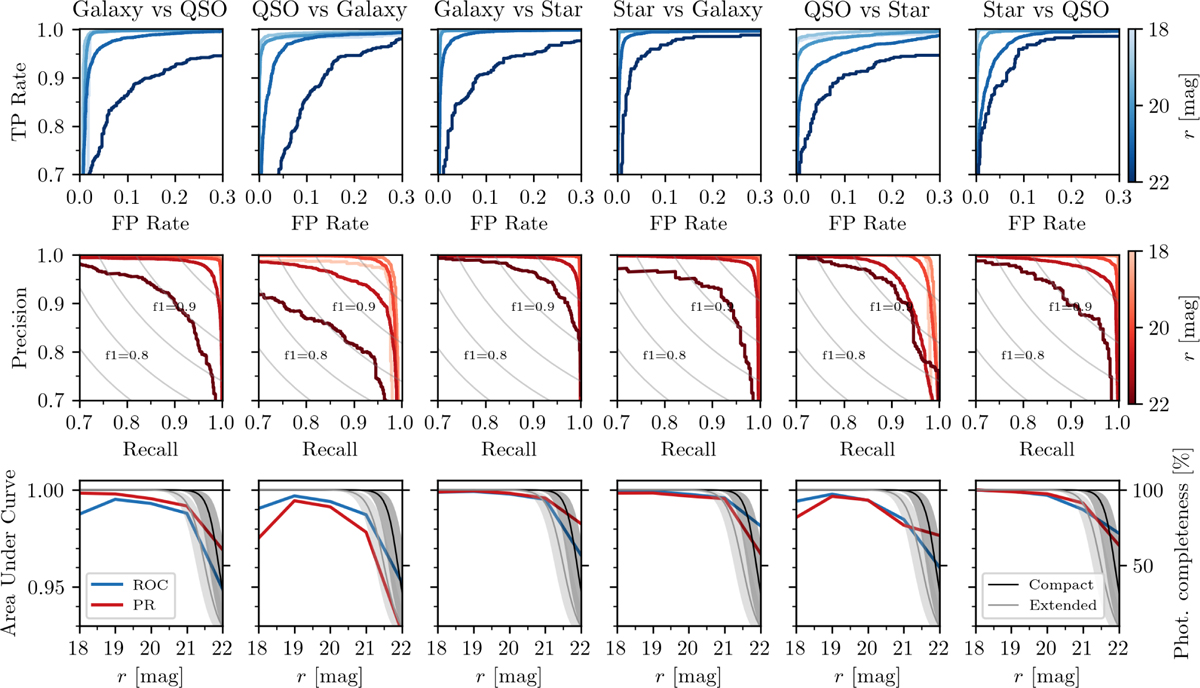
Fig. 8
Download original image
Dependence of model performance on the S/N of the sources. The top panels present the ROC curves for objects within different magnitude bins, shaded in varying tones of blue. Magnitude bins range from r = 17.5 to r = 22.5 mag in 0.5 mag increments (10 bins). The middle panels exhibit the Precision-Recall (PR) curves, illustrating the trade-off between sample purity and completeness, shaded in different red tones according to magnitude bin. Both quantities are related by ƒ 1, the harmonic mean of precision and recall, for which several values are plotted. Notice that the axes are a zoomed version of those in Fig. 7, spanning rates from 0 to 0.3 for FPs and 0.7 to 1 for TPs, Precision, and Recall. The bottom panels summarize the results, depicting the evolution of the AUC for both ROC and PR curves relative to the central magnitude of each bin. Blue and red colors denote the AUCs for ROC and PR, respectively. The median photometric completeness for compact and extended sources within J-PLUS is shown by dark and light gray curves, respectively, with surrounding gray shaded areas indicating the 16th and 84th percentiles of completeness. Classification remains near-perfect up to r ~ 21 mag (AUC ≳ 0.99 for both curves), thereafter beginning to diminish, aligning with J-PLUS’s limiting magnitude and the ensuing loss of information in some bands. However, even under the most challenging conditions, such as distinguishing QSOs from galaxies or stars, ROC and PR AUC values maintain levels of ~0.98 and ~0.93 at r = 22 mag, respectively, showcasing outstanding model performance. Notably, BANNJOS exhibits a propensity for mistaking QSOs for galaxies and vice versa at magnitudes brighter than r ~ 18 mag, possibly due to active galaxies within the test (and training) sample being variably classified as galaxies or QSOs based on the specific spectroscopic survey.
Current usage metrics show cumulative count of Article Views (full-text article views including HTML views, PDF and ePub downloads, according to the available data) and Abstracts Views on Vision4Press platform.
Data correspond to usage on the plateform after 2015. The current usage metrics is available 48-96 hours after online publication and is updated daily on week days.
Initial download of the metrics may take a while.