Fig. 7
Download original image
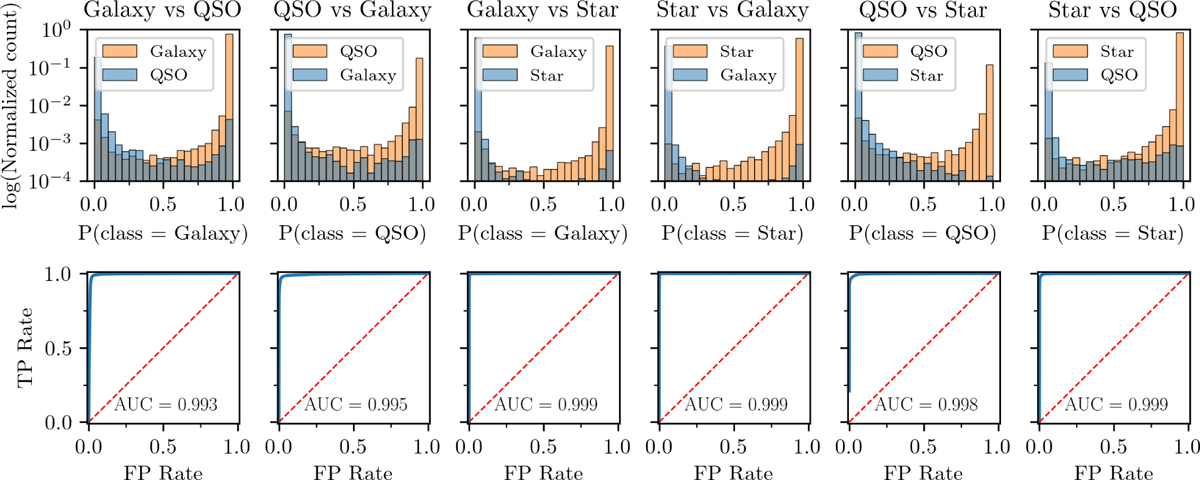
Model performance evaluated up to the limiting magnitude of J-PLUS DR3 (r = 21.8 mag, see Table 1). The performance was assessed on the test sample, consisting of 136 570 objects. The top panels illustrate the distribution of probabilities (in logarithmic scale) for objects being classified according to their spectroscopic category. The difference in bar heights reflects the different amount of sources present in the test sample. The bottom panels depict the ROC curves in blue for each class combination. These curves approach the maximum True Positive Rate (1) almost immediately, demonstrating excellent model performance. The AUC exceeds 0.99 for all six class combinations.
Current usage metrics show cumulative count of Article Views (full-text article views including HTML views, PDF and ePub downloads, according to the available data) and Abstracts Views on Vision4Press platform.
Data correspond to usage on the plateform after 2015. The current usage metrics is available 48-96 hours after online publication and is updated daily on week days.
Initial download of the metrics may take a while.