Fig. 5
Download original image
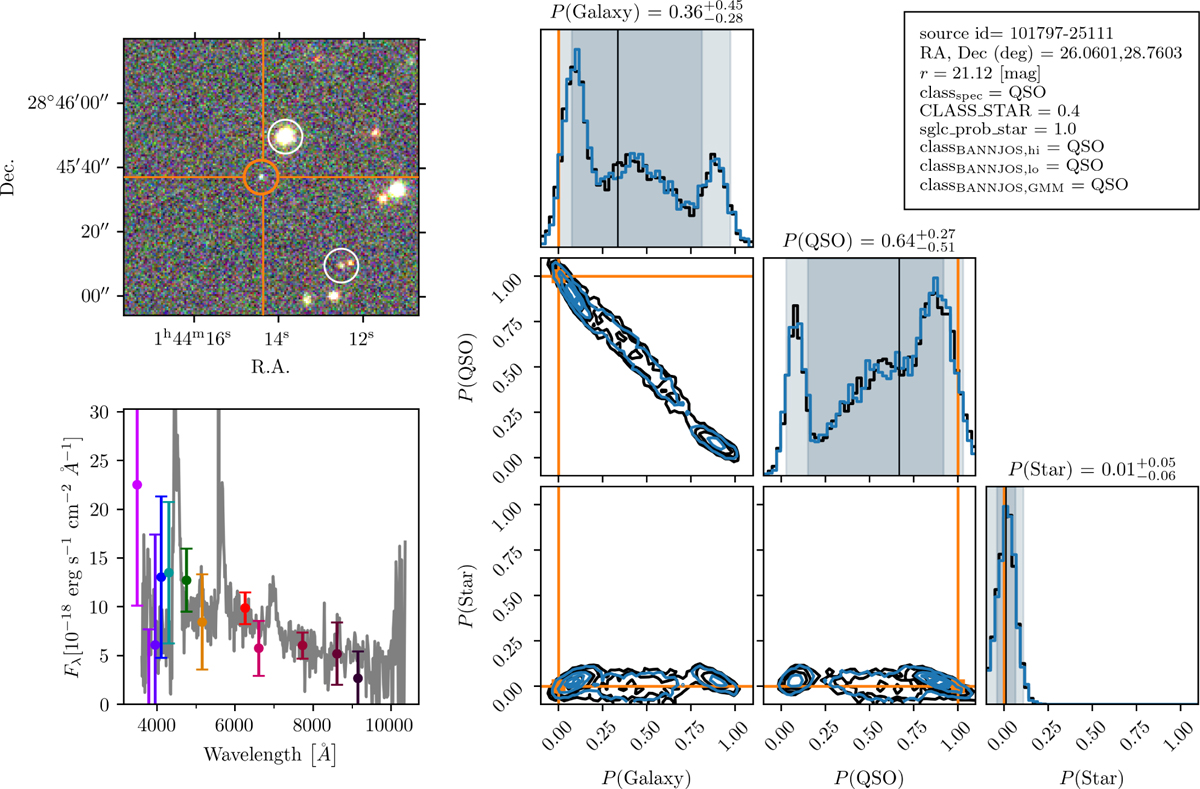
Example of results obtained with BANNJOS for the source Tile Id = 101797, Number = 25111. Upper left: J-PLUS color image composed using the r, 𝑔, and i bands. The fluxes in each band have been normalized between the 1st and 99th percentile of the total flux. The classified source is at the center of the reticle, marked by an orange open circle, while other sources detected in the J-PLUS catalog are marked with white open circles. Lower left: SDSS spectrum undersampled by a factor of ten for improved visibility (in gray) alongside J-PLUS photometry across its 12 bands. Right: corner plot illustrating the three-dimensional posterior probability distributions for P(class = Galaxy), P(class = QSO), and P(class = Star). Orange lines denote the spectroscopic class, ytrue. Black contours and histograms represent the posterior probability distribution sampled 5000 times (classBANNJOS,hi), with black lines indicating the median probability for each class and the gray-shaded area covering the 2nd to 98th (lighter gray) and the 16th to 84th (darker gray) percentile ranges. Blue contours, histograms, and shaded areas depict the reconstructed posterior probability distribution from the GMM model fitted to N = 300 points. A text box in the upper right corner lists the complete source ID, its r magnitude, the ’true’ classification from spectroscopy (classspec), its CLASS_STAR and sglc_prob_star scores, and the BANNJOS classifications from the high-quality posterior sampling (N = 5000, classBANNJOS,hi), the regular-quality posterior sampling (N = 300, classBANNJOS,lo), and the classification from the reconstructed PDF following the GMM compression method, classBANNJOS,GMM. The classification is determined as the one with the highest median probability value. Despite its complexity, the PDFs obtained from sampling 5000 times and the one after reconstruction from the GMM are nearly indistinguishable, with gray and blue contours and shaded areas covering the same areas. The corresponding classifications, classBANNJOS,hi (black) and classBANNJOS,GMM (blue), also match the spectroscopic classification. The GMM compression procedure is described in Appendix C.
Current usage metrics show cumulative count of Article Views (full-text article views including HTML views, PDF and ePub downloads, according to the available data) and Abstracts Views on Vision4Press platform.
Data correspond to usage on the plateform after 2015. The current usage metrics is available 48-96 hours after online publication and is updated daily on week days.
Initial download of the metrics may take a while.