Fig. 4
Download original image
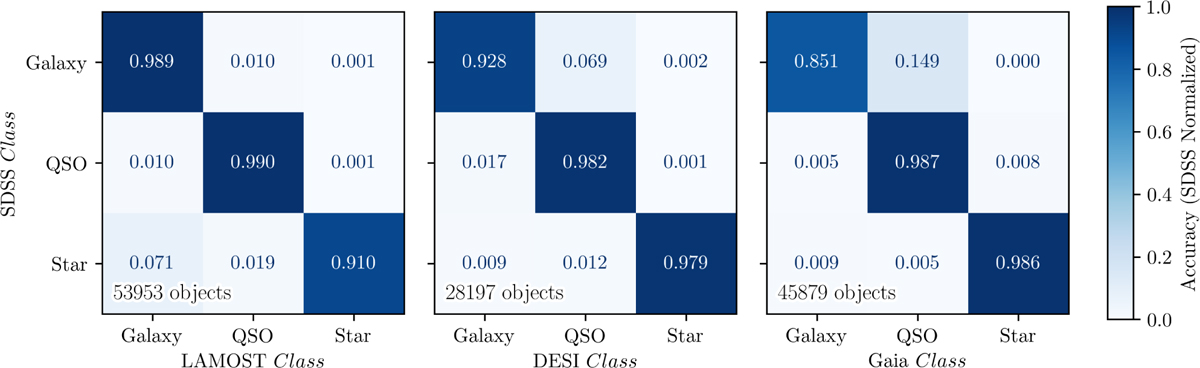
Confusion matrices between the four surveys used to compile the training list. The proportion of objects in each bin relative to the total number of objects in SDSS is indicated by varying shades of blue and is presented as a real number ∈ [0,1]. The confusion matrices also specify the total number of objects used in their computation.
Current usage metrics show cumulative count of Article Views (full-text article views including HTML views, PDF and ePub downloads, according to the available data) and Abstracts Views on Vision4Press platform.
Data correspond to usage on the plateform after 2015. The current usage metrics is available 48-96 hours after online publication and is updated daily on week days.
Initial download of the metrics may take a while.