Fig. 3
Download original image
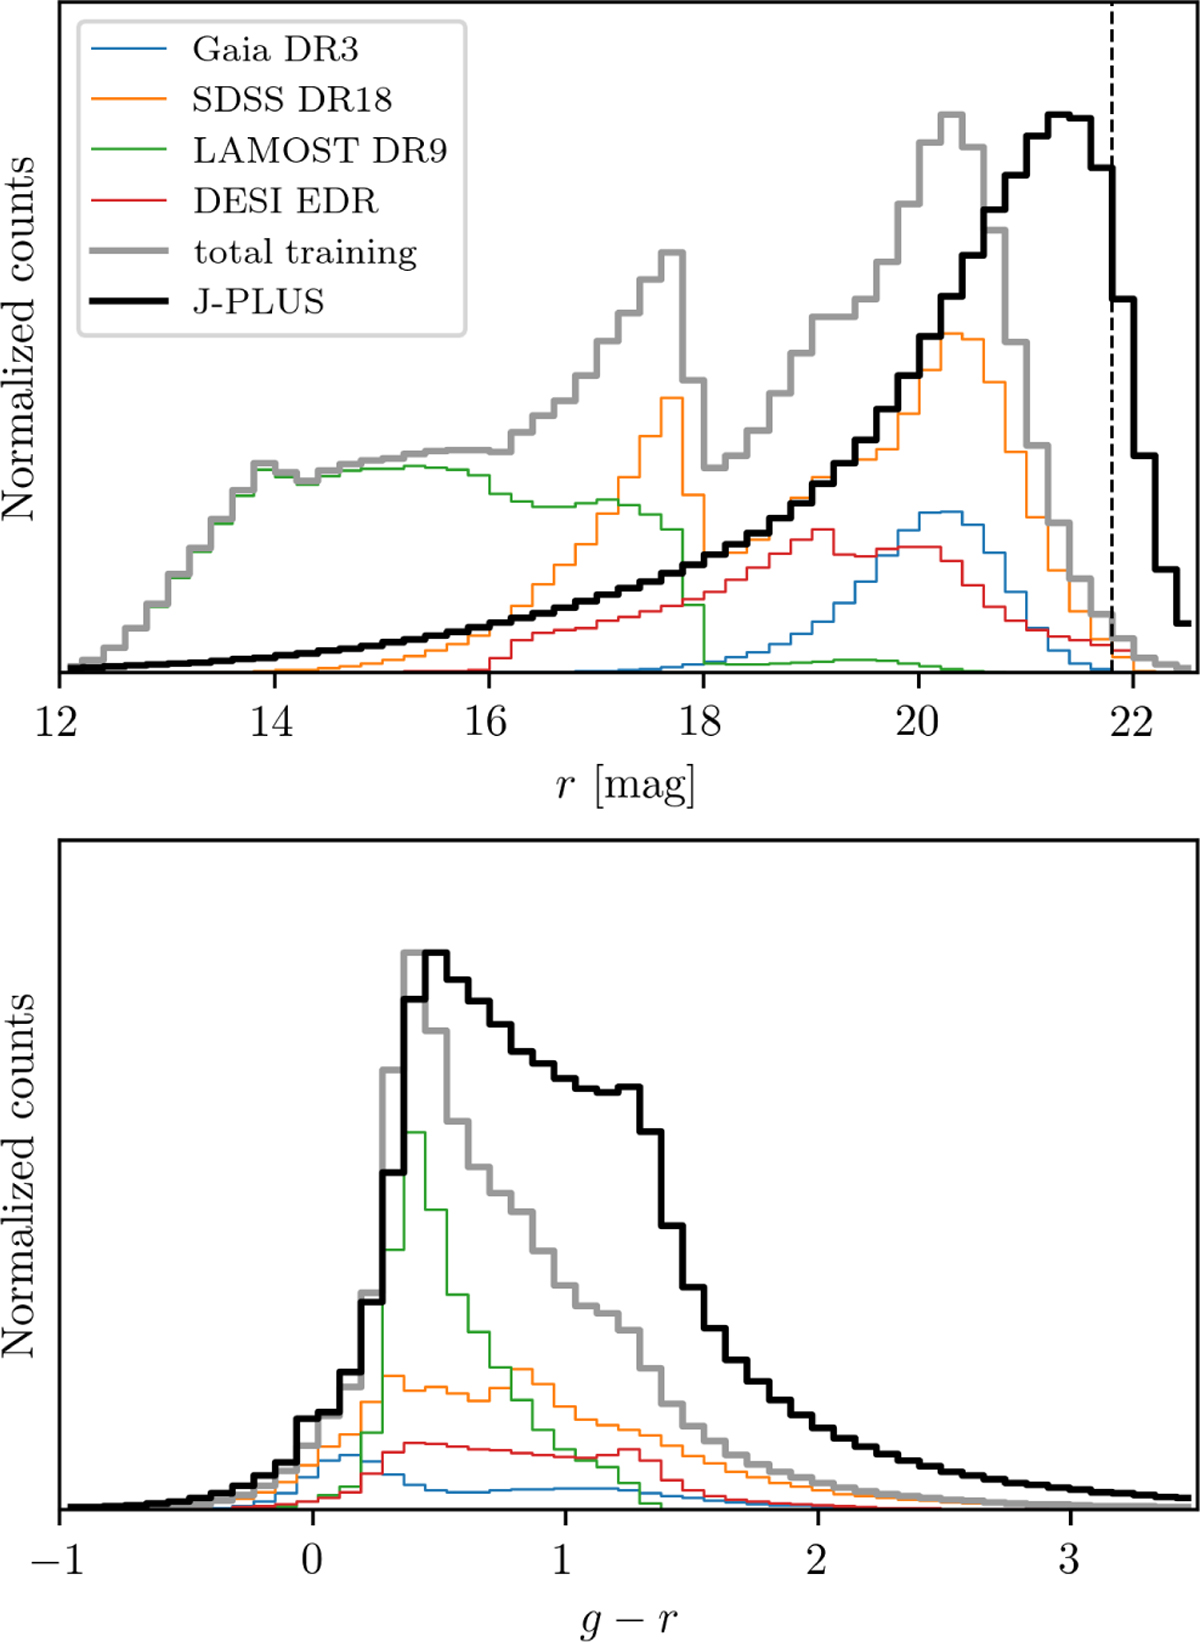
Distribution of the r magnitude (top panel) and ɡ − r color (bottom panel) for the sources in J-PLUS and the training list. The distribution of sources from each contributing survey is depicted by thin lines in various colors (as in Fig. 2). The aggregate training list is represented by a thick gray line, while the entirety of J-PLUS sources, 47 751 865 objects, is shown by a thick black line. Histograms related to the training list have been normalized to the peak of the total training list (gray line), whereas the J-PLUS histograms have been normalized to their own peak. A vertical thin dashed line shows the limiting magnitude of J-PLUS DR3 (r = 21.8 mag, see Table 1). The extended tail of objects with ɡ − r ≳ 1.5 is mostly composed by low S/N sources with poorly determined ɡ magnitude.
Current usage metrics show cumulative count of Article Views (full-text article views including HTML views, PDF and ePub downloads, according to the available data) and Abstracts Views on Vision4Press platform.
Data correspond to usage on the plateform after 2015. The current usage metrics is available 48-96 hours after online publication and is updated daily on week days.
Initial download of the metrics may take a while.