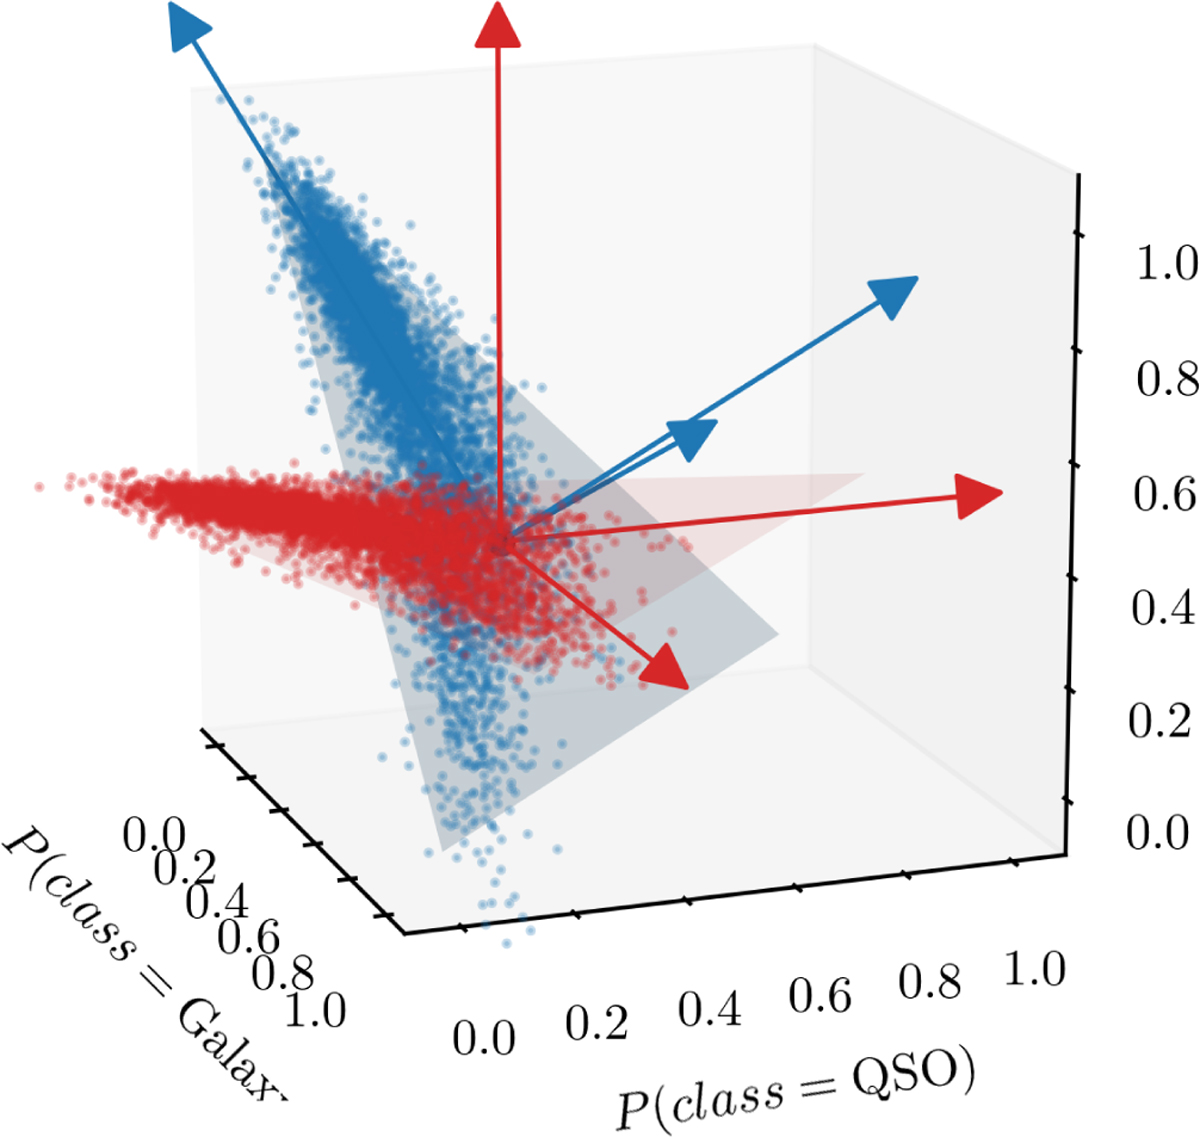
Fig. C.1
Download original image
Sampling from the posterior of the model for Tile Id = 94217 and Number = 10482, a source with low S/N. Each blue point represents a sample from the BANN (N = 5000). The most probable class is ’star’, though BANNJOS also assigns some probability to the ‘galaxy’ class. The points distribute on the plane P(class = Galaxy) + P(class = QSO) + P(class = Star) = 1, as expected. Blue arrows represent the eigenvectors of the 3-dimensional space defined by the probabilities of belonging to each of the three classes. A rotation (Eq. (C)) applied to the blue points allows for dimension reduction, transforming them into the red points on the horizontal plane. The red arrows denote the eigenvectors of this plane.
Current usage metrics show cumulative count of Article Views (full-text article views including HTML views, PDF and ePub downloads, according to the available data) and Abstracts Views on Vision4Press platform.
Data correspond to usage on the plateform after 2015. The current usage metrics is available 48-96 hours after online publication and is updated daily on week days.
Initial download of the metrics may take a while.