Fig. B.1
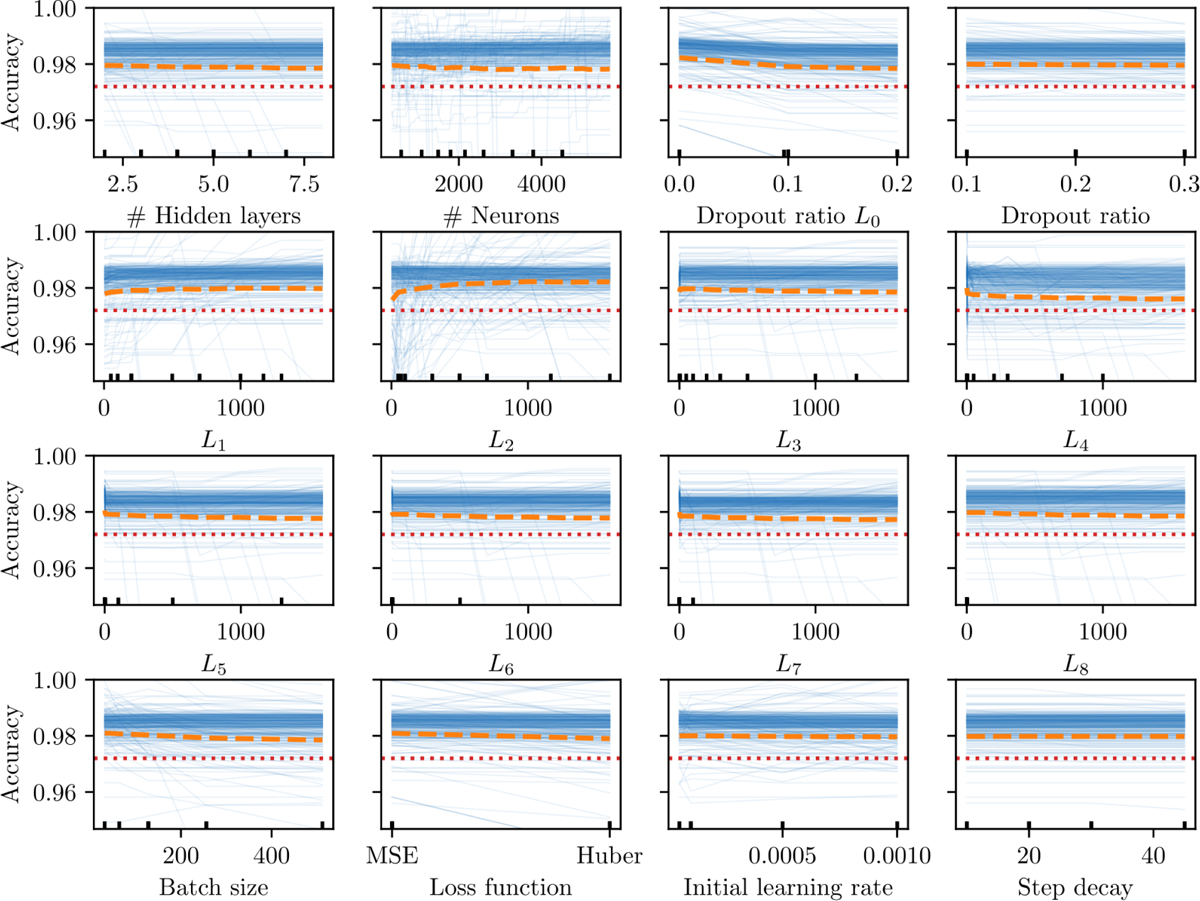
Download original image
Individual conditional expectation curves for the model accuracy. Each blue line represents the accuracy of the model depending on the chosen value for each hyperparameter. The orange dashed line indicates the mean accuracy value, approximately 0.98, which is below the median accuracy value, closer to 0.99. The red dashed line represents the performance of a Random Forest Regressor with 500 trees. Most hyperparameters have minimal impact on model performance, except for the Dropout at L0, and the number of neurons at levels L1–4.
Current usage metrics show cumulative count of Article Views (full-text article views including HTML views, PDF and ePub downloads, according to the available data) and Abstracts Views on Vision4Press platform.
Data correspond to usage on the plateform after 2015. The current usage metrics is available 48-96 hours after online publication and is updated daily on week days.
Initial download of the metrics may take a while.