Fig. 19
Download original image
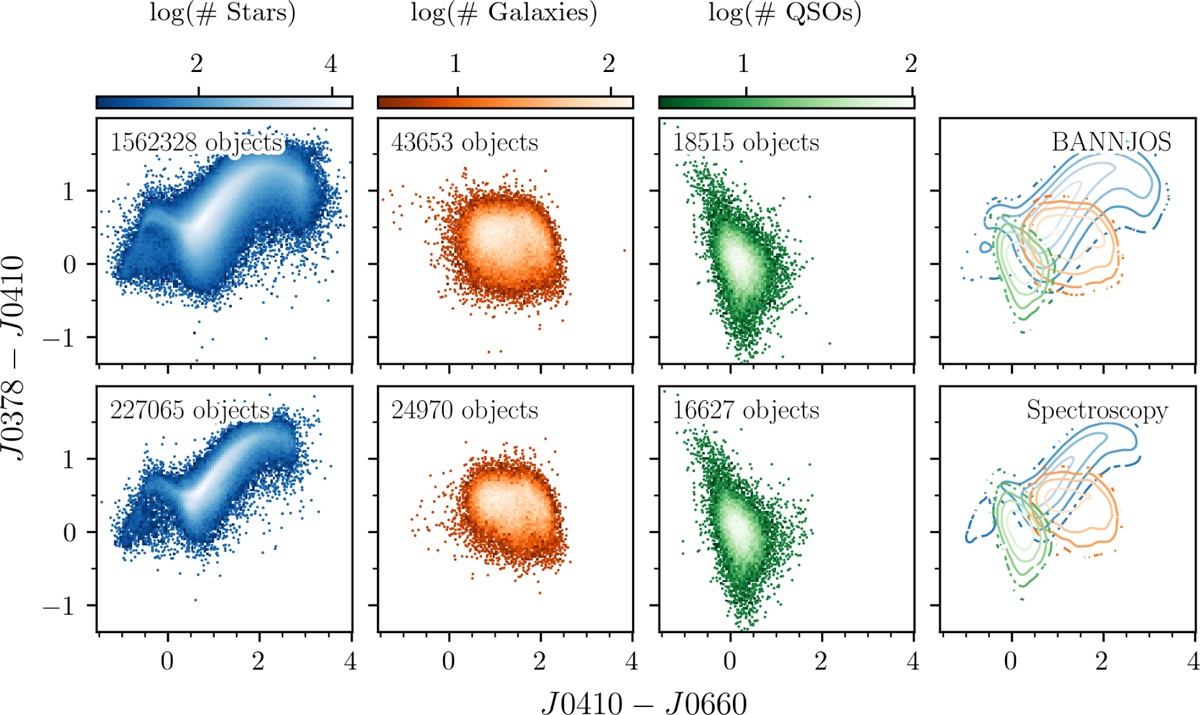
Color–color diagrams for the three available classes. Stars, Galaxies, and QSOs are shown in blue, orange, and green, respectively, with their distributions in the left, middle-left, and middle-right columns. The color shading corresponds to object density on a logarithmic scale, computed separately for each class. The right column shows the concentration of objects for each class using correspondingly colored contours. The top row shows BANNJOS classification for the entire J-PLUS catalog based on the 2σ selection criterion. The bottom row shows the spectroscopic classification in the training sample. For clarity, we restricted the sample to sources with photometric uncertainties and reddening below 0.25 mag, and no photometric flags: 1 624496 sources predicted by BANNJOS (top panels) and 268 662 in the spectroscopic sample (bottom panels). The distribution of sources is very similar, indicating that BANNJOS is effectively recovering the object classes even though colors were not used during model training.
Current usage metrics show cumulative count of Article Views (full-text article views including HTML views, PDF and ePub downloads, according to the available data) and Abstracts Views on Vision4Press platform.
Data correspond to usage on the plateform after 2015. The current usage metrics is available 48-96 hours after online publication and is updated daily on week days.
Initial download of the metrics may take a while.