Fig. 18
Download original image
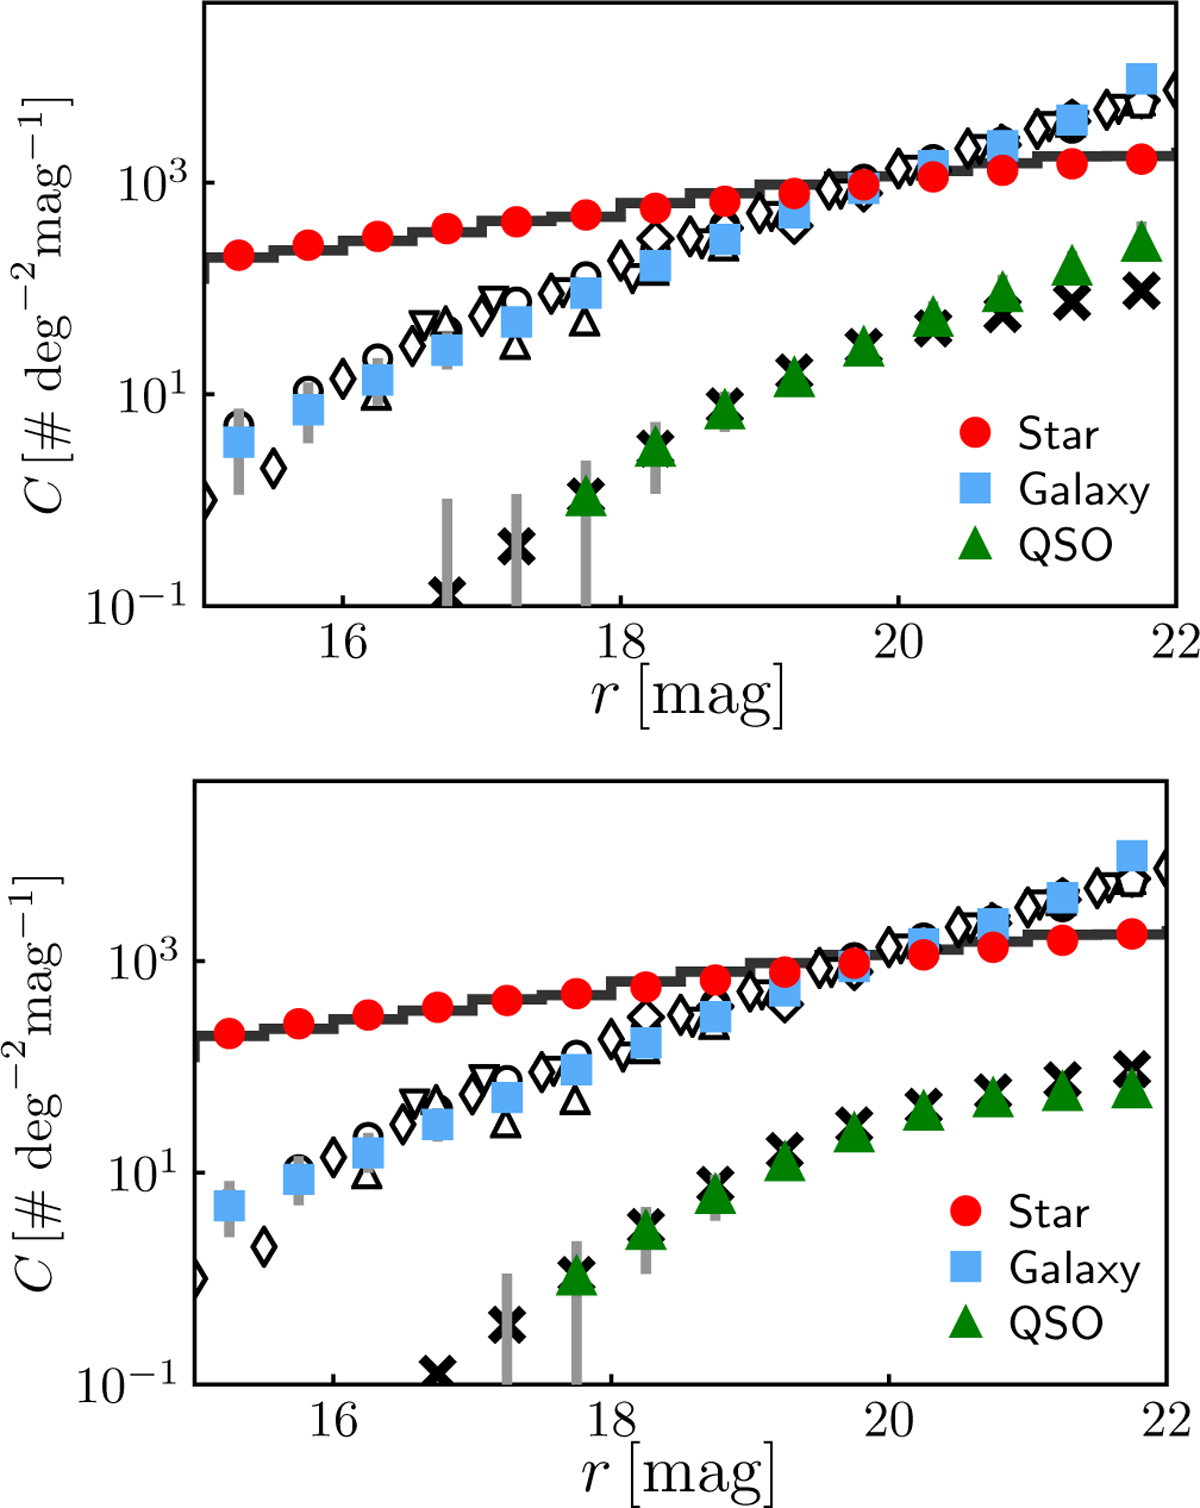
Number counts of objects as a function of r-band magnitude. Top panel: number counts for stars (red dots), galaxies (blue squares), and QSOs (green triangles) as a function of r-band magnitude. These were estimated as the median of the 1642 J-PLUS DR3 pointings, using the maximum median probability criteria to assign classes. Vertical gray lines show the variance in number counts between pointings. Black solid histograms represent stellar number counts at the median pointing position, estimated using the TRILEGAL model of the Milky Way (Girardi et al. 2005). Open symbols denote galaxy number counts from literature sources: Yasuda et al. (2001, circles); Huang et al. (2001, triangles); Kümmel & Wagner (2001, inverted triangles); and Kashikawa et al. (2004, diamonds). Black crosses show QSO number counts as predicted by Palanque-Delabrouille et al. (2016). Bottom panel: similar to the top panel but applying the more restrictive 2σ selection criteria.
Current usage metrics show cumulative count of Article Views (full-text article views including HTML views, PDF and ePub downloads, according to the available data) and Abstracts Views on Vision4Press platform.
Data correspond to usage on the plateform after 2015. The current usage metrics is available 48-96 hours after online publication and is updated daily on week days.
Initial download of the metrics may take a while.