Fig. 13
Download original image
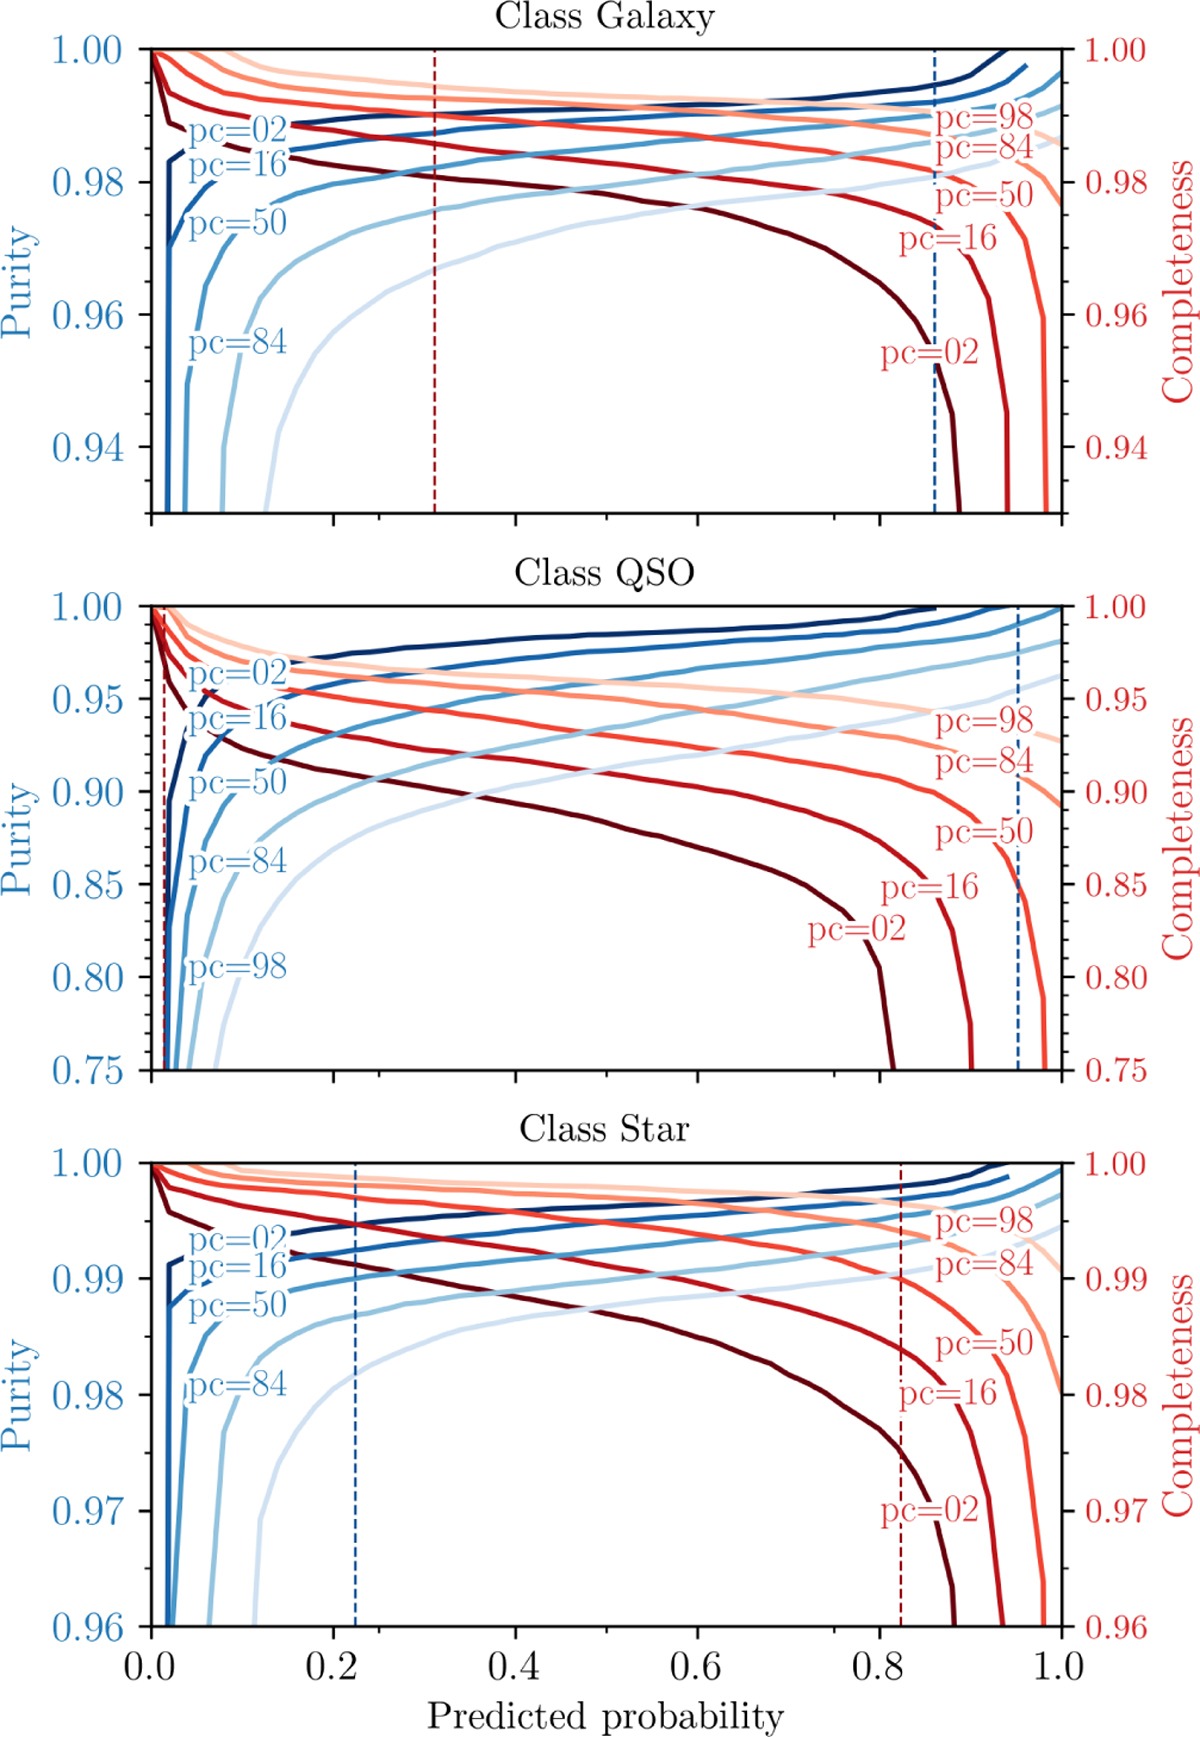
Purity versus completeness for the selection based on different thresholds for each class From top to bottom, the panels show the galaxy, QSO, and star class. The curves represent purity (blue) and completeness (red) of the sample as functions of the chosen threshold and percentile used to select the class. Vertical dashed lines in corresponding colors indicate the probability thresholds required to achieve 99% purity (blue) and 99% completeness (red), respectively.
Current usage metrics show cumulative count of Article Views (full-text article views including HTML views, PDF and ePub downloads, according to the available data) and Abstracts Views on Vision4Press platform.
Data correspond to usage on the plateform after 2015. The current usage metrics is available 48-96 hours after online publication and is updated daily on week days.
Initial download of the metrics may take a while.