Fig. 12
Download original image
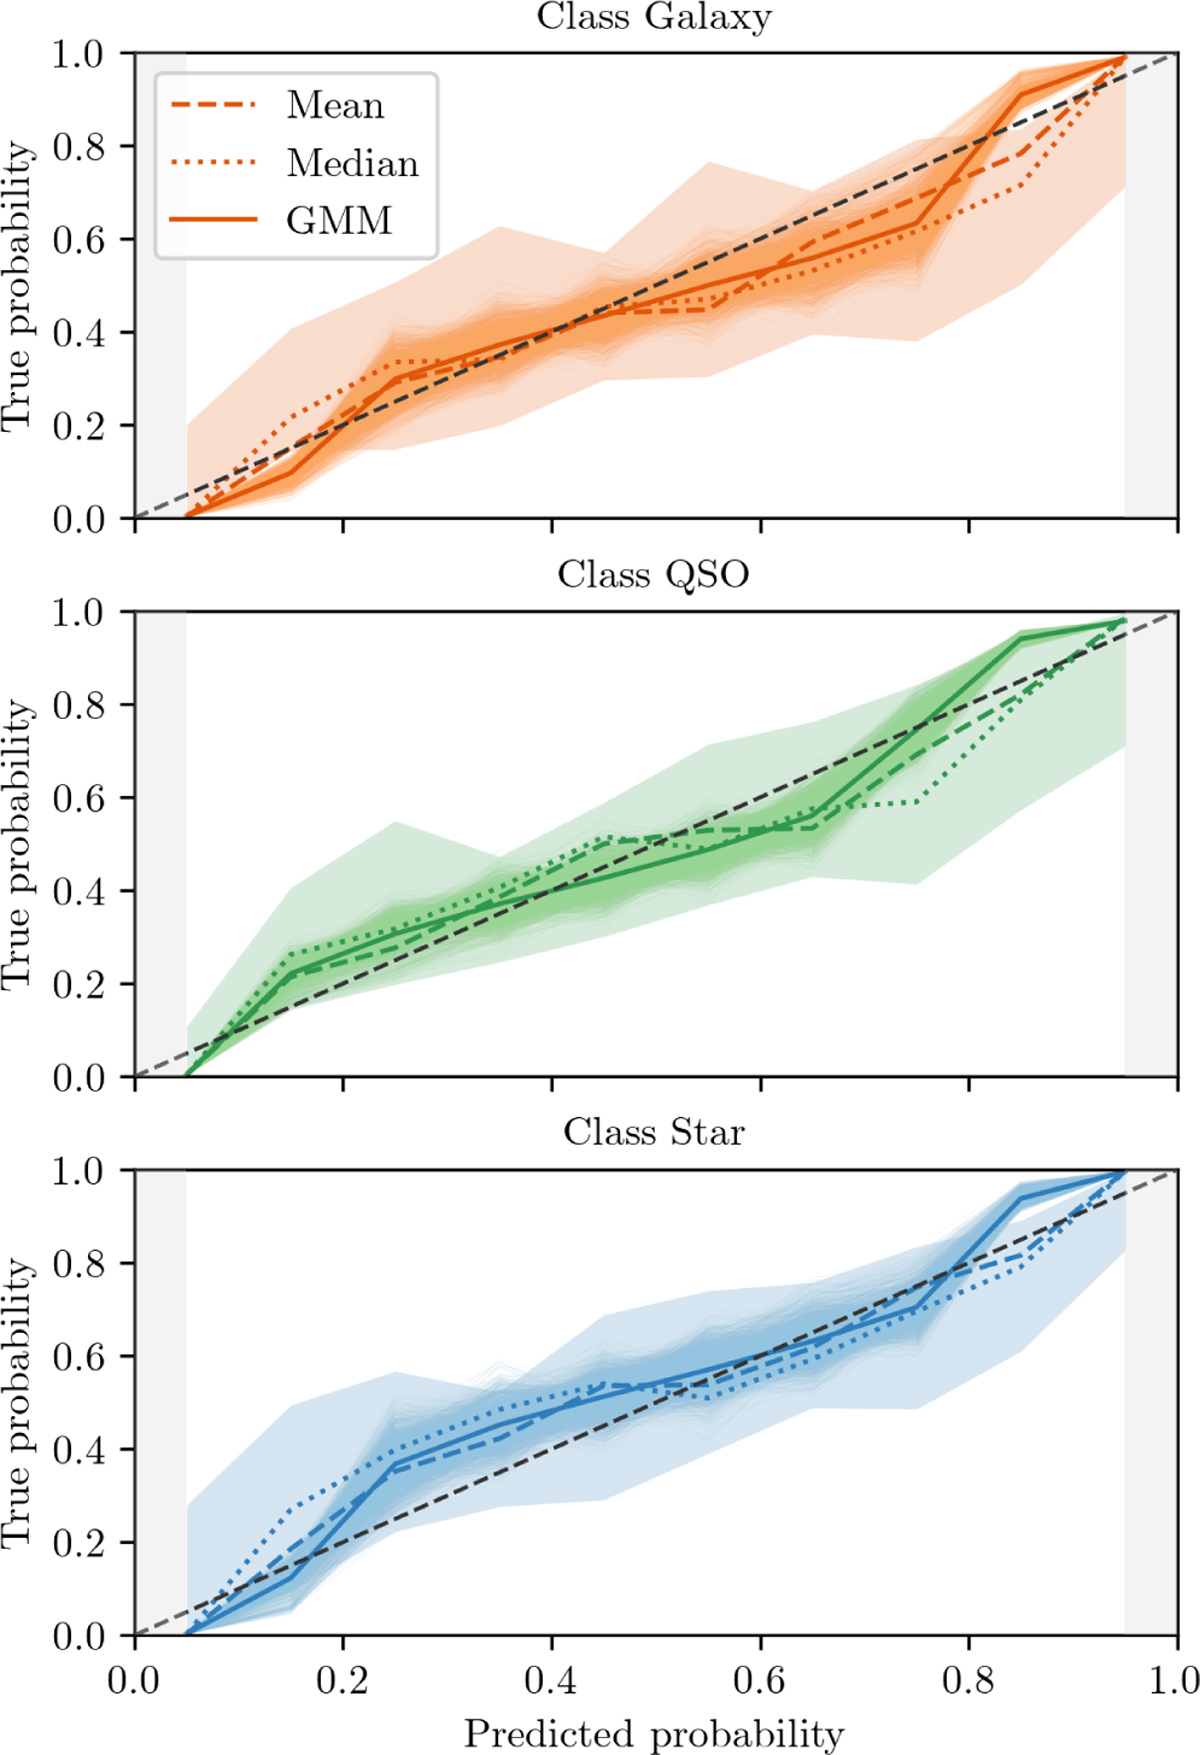
Predicted versus true probability for the selection based on different thresholds for each class. From top to bottom, the panels show the galaxy, QSO, and star class. For each class, the true probability is derived as the amount of objects with confirmed spectroscopic class divided by the total number of objects in each probability interval. The probability intervals are measured on the predicted probability from zero to one in steps of 0.1 (ten in total). The predicted probability is the probability derived with BANNJOS using three different methods: The mean probability, the median probability, and the mean probability from the reconstructed PDF using the GMM model. The light shaded areas show the true probability of the sample if the 16th or the 84th percentile is used to select the sample. The uncertainties from the GMM model are shown by darker shaded areas and are computed by sampling the model 2000 times. The diagonal dashed line shows the one-to-one relation. Due to the binning used to create the figure, there is only data in the [0.05, 0.95] range.
Current usage metrics show cumulative count of Article Views (full-text article views including HTML views, PDF and ePub downloads, according to the available data) and Abstracts Views on Vision4Press platform.
Data correspond to usage on the plateform after 2015. The current usage metrics is available 48-96 hours after online publication and is updated daily on week days.
Initial download of the metrics may take a while.