Fig. 11
Download original image
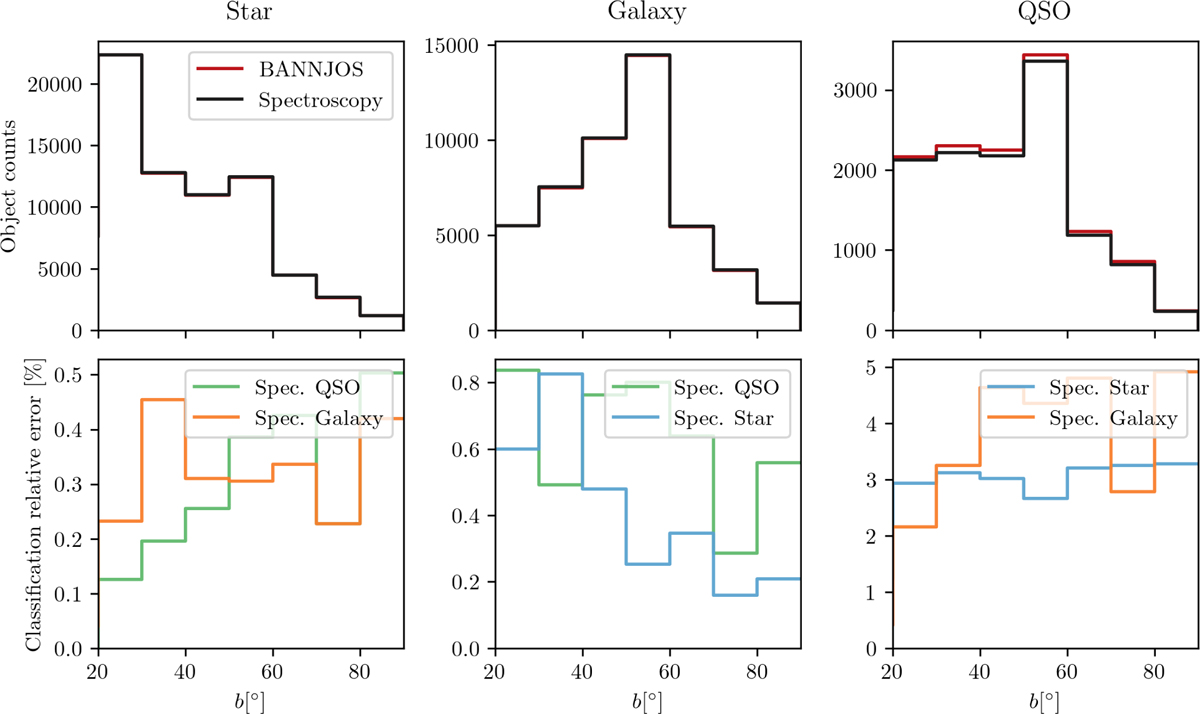
Number counts and contamination ratios as a function of Galactic latitude, b. Top panels: object counts for each class (star, galaxy, QSO, from left to right) of object classified spectroscopically (black) and by BANNJOS (red). Bottom panels: contamination ratios (FPs) in each class predicted by BANNJOS. The error is computed as the number of objects incorrectly assigned to each class by BANNJOS (one of the other two potential classes), divided by the number of objects of the spectroscopic class (i.e., star, galaxy, QSO) from left to right. Bins are computed in 10° increments from 20° to 90° for each class. The bin [10°,20°) is excluded from the analysis due to its very low number of galaxies (47).
Current usage metrics show cumulative count of Article Views (full-text article views including HTML views, PDF and ePub downloads, according to the available data) and Abstracts Views on Vision4Press platform.
Data correspond to usage on the plateform after 2015. The current usage metrics is available 48-96 hours after online publication and is updated daily on week days.
Initial download of the metrics may take a while.