Fig. 10
Download original image
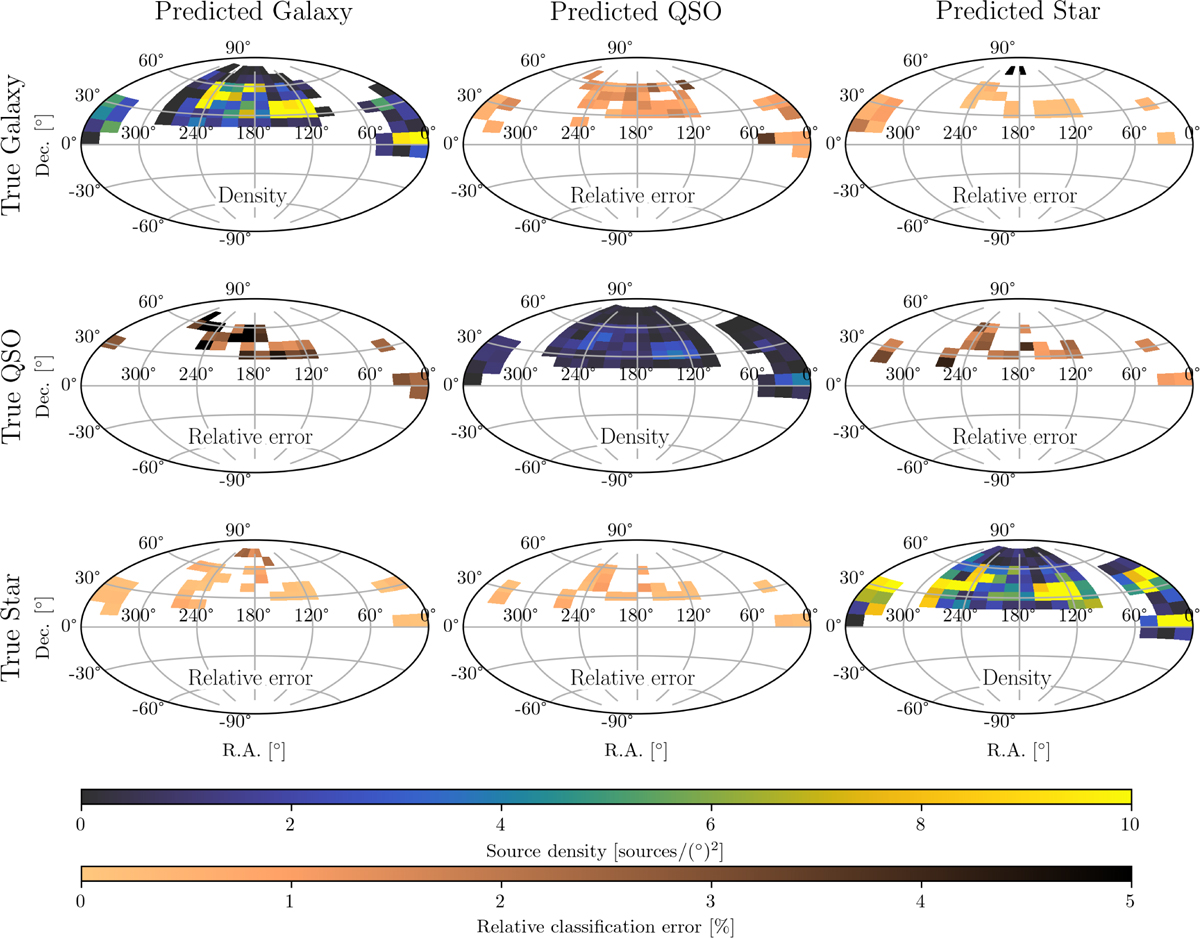
Sky maps illustrating the surface density and expected contamination ratios for each class from the test sample. Panels are arranged as in a confusion matrix, with true classes, ytrue, on the vertical axis and predicted classes, ypred, on the horizontal axis. Diagonal panels display the sky surface density of sources classified into each category – galaxies, QSOs, and stars – uniformly scaled in color. The off-diagonal panels show the relative classification error for given true and predicted classes, calculated as the number of misclassified sources divided by the total number of objects in the true class. A minimum of 4 sources is required in order to compute the classification error. The off-diagonal panels share a distinct color scale from the diagonal ones. No apparent trends are visible based on sky position.
Current usage metrics show cumulative count of Article Views (full-text article views including HTML views, PDF and ePub downloads, according to the available data) and Abstracts Views on Vision4Press platform.
Data correspond to usage on the plateform after 2015. The current usage metrics is available 48-96 hours after online publication and is updated daily on week days.
Initial download of the metrics may take a while.